
As I’ve been gathering data for my future site and thinking about some of the analysis I want to do, I thought it would be wise to provide a taste of what to expect from my posts – so I did a quick analysis on the NHL salaries last season (2018 – 2019).
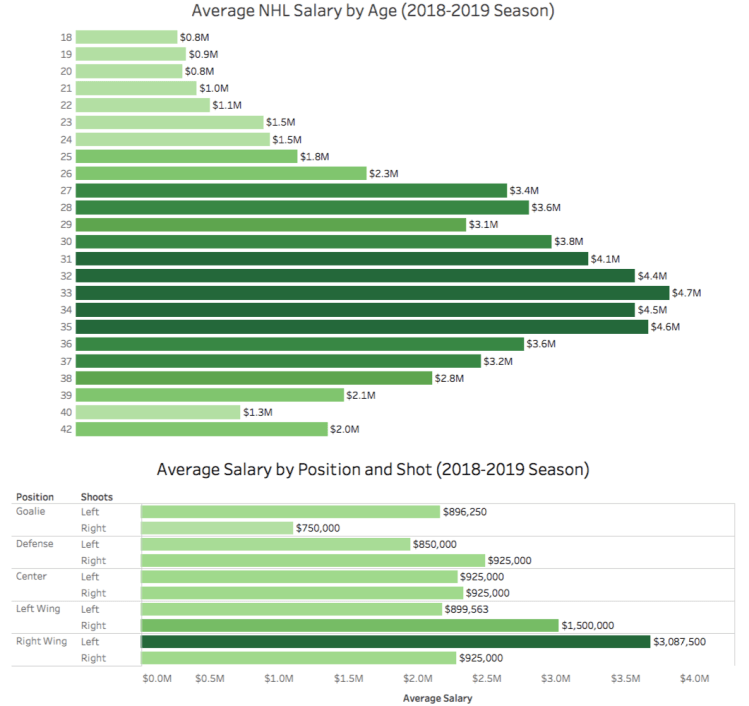
Starting off, I graphed the average salary by age last season in the NHL. As you can see from the first graph, the 33 year olds take the cake with $4.7 million a year. They’re followed closely by 35, 34, 32, and 30 year olds who all are above the $4.0 million annually (must be nice).
Second, I wanted to know what position made the most on average. No surprise to me when I saw the wings made the most. What was a surprise is the major discrepancy between left and right shots in both wing categories – left handed right wings and right handed left wings make more than their counterparts. While I have never really thought about it this way, it does make sense…lets think about left handed right right wings. If you are left handed and on the right wing your forward handed shot will be towards the center of the ice most of the time. One could concluded that you have a better angle on the goalie than if the puck was on the other side of your body (for a backhanded shot), this gives you a higher chance of scoring, creating more points, and thus getting paid more (we will look at this comparison below).
The next set of graphs really look at how a team’s points were related to their players’ salaries.

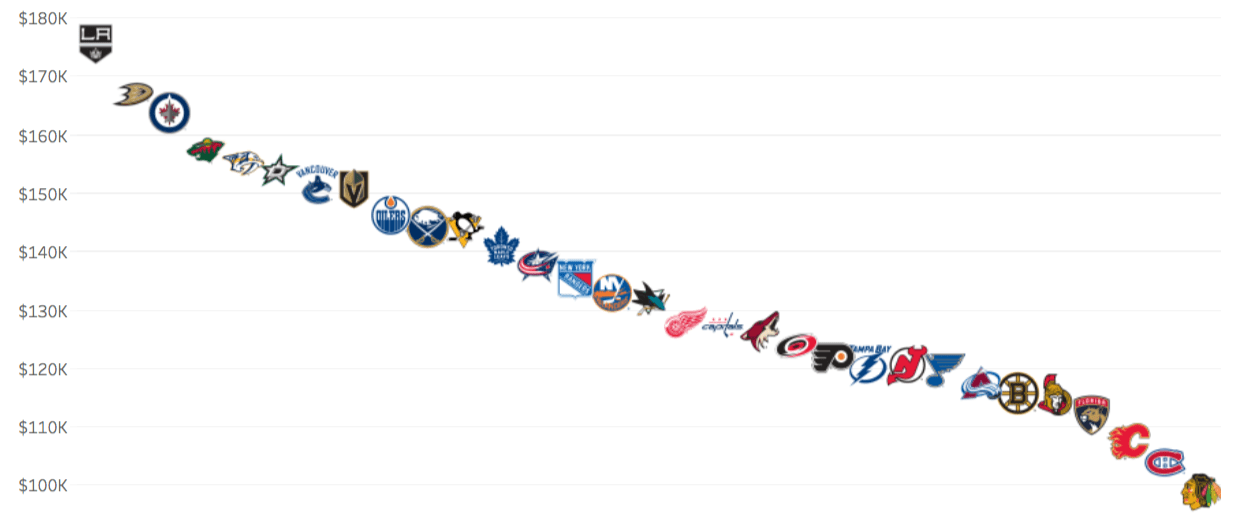
The first graph is showing how “efficient” a team was at spending their money. I took the team’s total salary amount and divided it by their total number of team points. So, a higher number is “less efficient” (it cost more per point).
With about $176,000 per point, the LA Kings took the title for least efficient team in the NHL. Big contracts on the books for players like Drew Doughty, Anze Kopitar, and Jonathan Quick, combined with their abysmal season last year (31 – 42 – 9) it makes sense why they’re in this spot.
With just $99,000 spent per point, the Chicago Blackhawks were a different story. They were the most efficient team. While their salary, on average, was actually more than the King’s, their better season (36 – 34 – 12) certainly helped them in this efficiency metric.
The final graph is a scatter plot of every player’s salary vs. their points (not goals, points). A players position is denoted by the different colors. In general as a players salary increases so do their points (obviously, better players usually produce more points and get paid more). In fact, last year an increase of $190,000 in a player’s salary equated to 1 additional point on average.
Sources:
https://puckpedia.com/
https://www.hockey-reference.com/

Cool idea!
LikeLike