

This week’s post looks into the make up of the NFL players by Colleges. It’s a little different than my others – meaning it is not nearly as numbers heavy.
First, I looked into what colleges have the most players currently on NFL rosters.
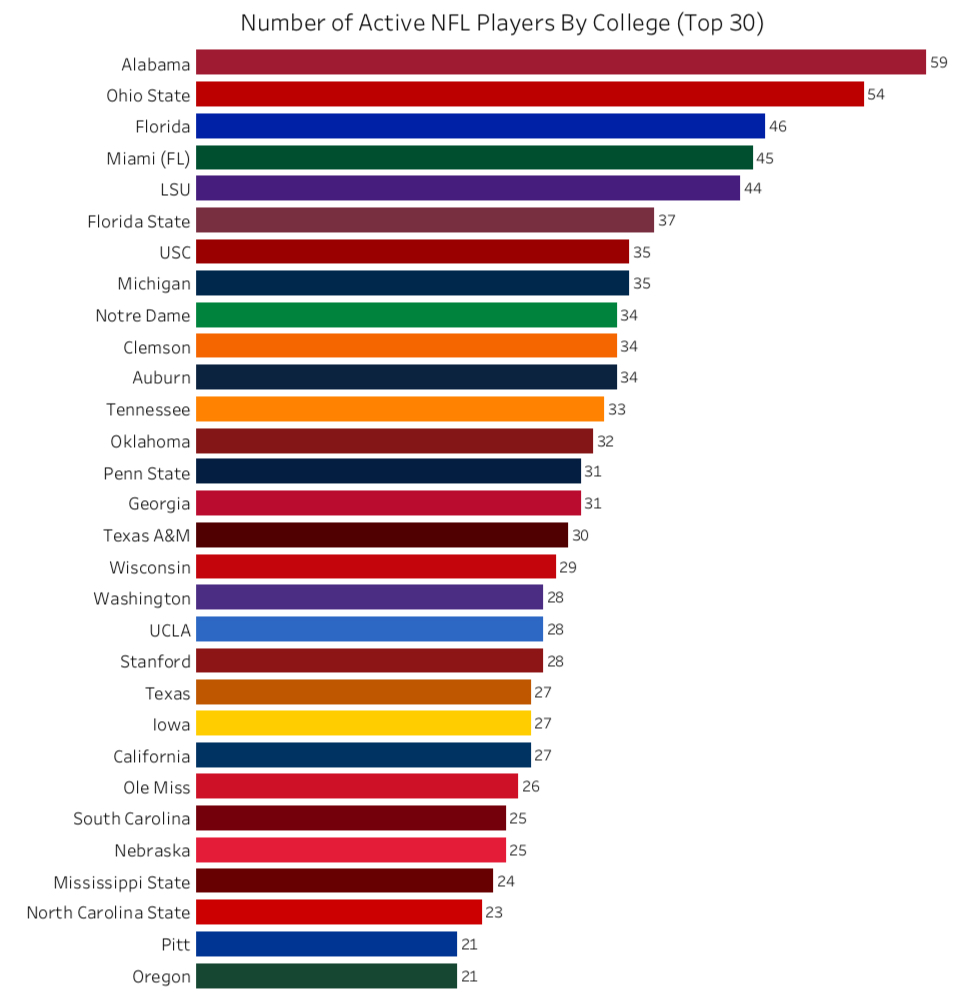
Alabama and Ohio State hold the top spots by quite a bit compared to Florida at number 3. Players like Derrick Henry, Julio Jones, Ezekiel Elliott, and Joey Bosa are certainly making their alma maters proud.
Currently 130 schools are represented on NFL rosters. 64 of those are from power five conferences and 66 are from others. However, 78.9% of active NFL rosters are of players from power five conference schools.
Second, I looked into the total number of players (including active players) from each school.
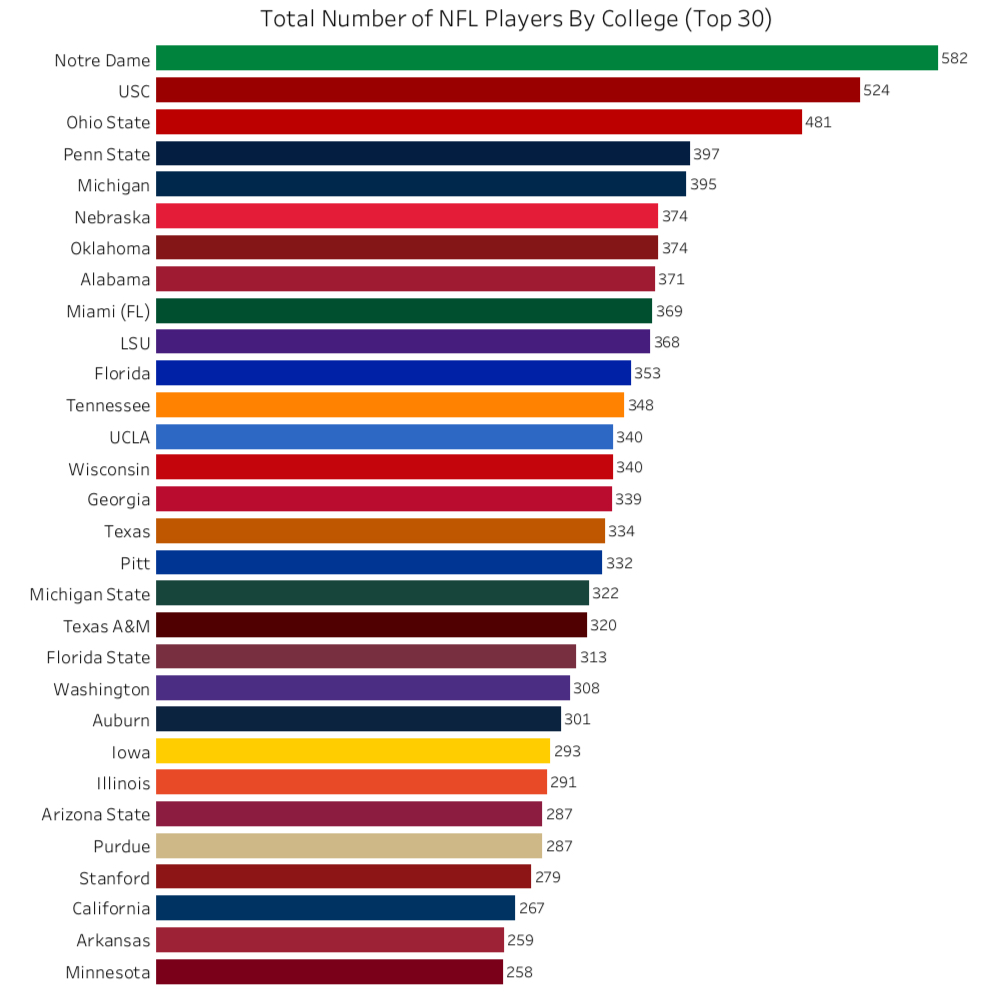
Notre Dame, USC, and Ohio State take the top three spots which is not surprising considering their historically successful franchises. Players like Tim Brown, Marcus Allen, Cris Carter, Bruce Matthews, and Paul Warfield all went to these schools and went on to have successful NFL careers.
The third graphic looks at the total number of players schools have ever had in the NFL and the total number of Pro Bowl Selections they’ve had. The shape of the point shows what conference that school was in; the color of the dot is the school’s color. However, blue dots mean the school is not from a power five conference. I added the linear trend line as well to show which schools outperform others.
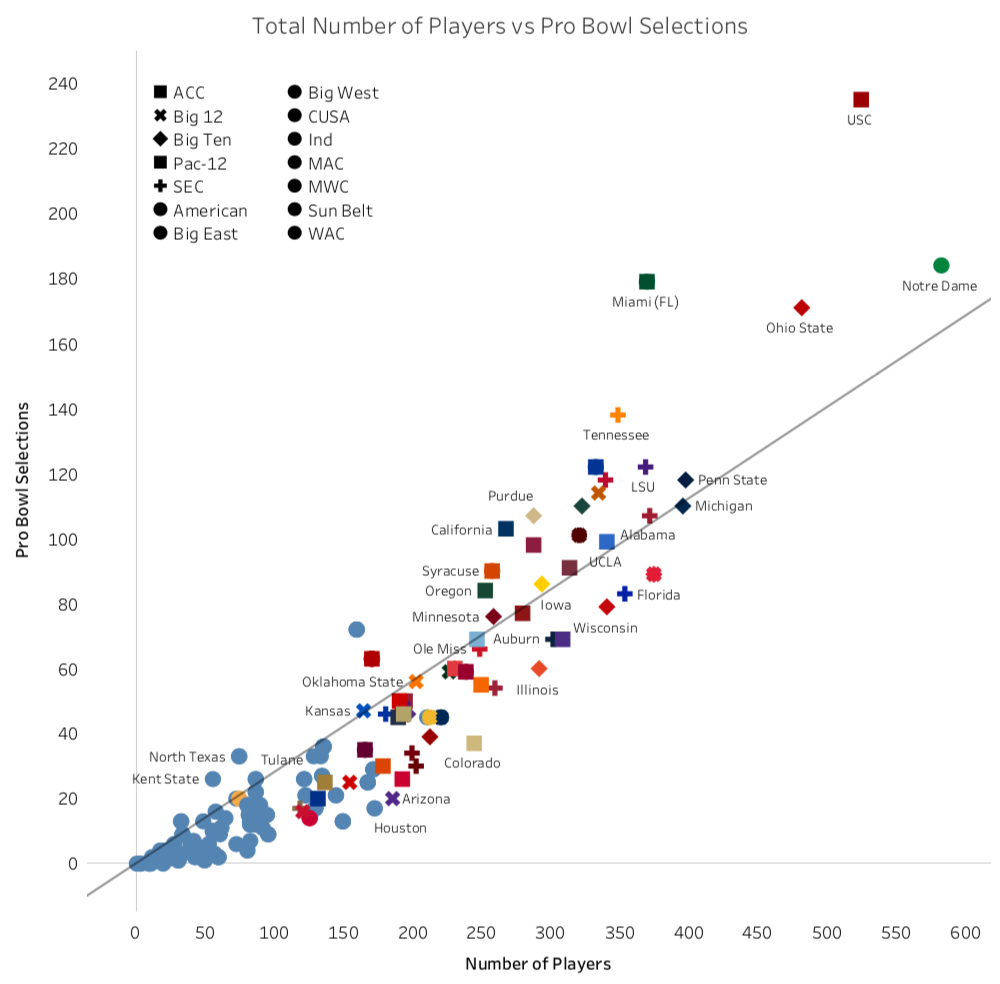
USC clearly has the most Pro Bowl Selections with 235. Second is Notre Dame with 184 and third in Miami (FL) with 179. North Texas certainly outperforms the norm having 33 Pro Bowl selections and only 74 total NFL players. Joe Green and Brian Waters are notable players.
Given their recent lack of success, surprisingly Kansas actually outperforms other schools by this measure. Under performing schools include Florida, Wisconsin, Illinois, and Colorado.
What is interesting here is the large grouping of non power five conference schools towards 0 and below the linear trend line. This suggests that while these schools are still sending players to the NFL, they are not becoming Pro Bowl players as much as the power five conference schools.
The linear trend line states that it takes (on average) about 4 players per college before one gets selected to the Pro Bowl.
The fourth and final graphic looks at the total number of games played by players from a school and the total number of touchdowns they scored. The shapes and colors of the points are the same as above. Again, I added the linear trend line to show which schools outperform others.
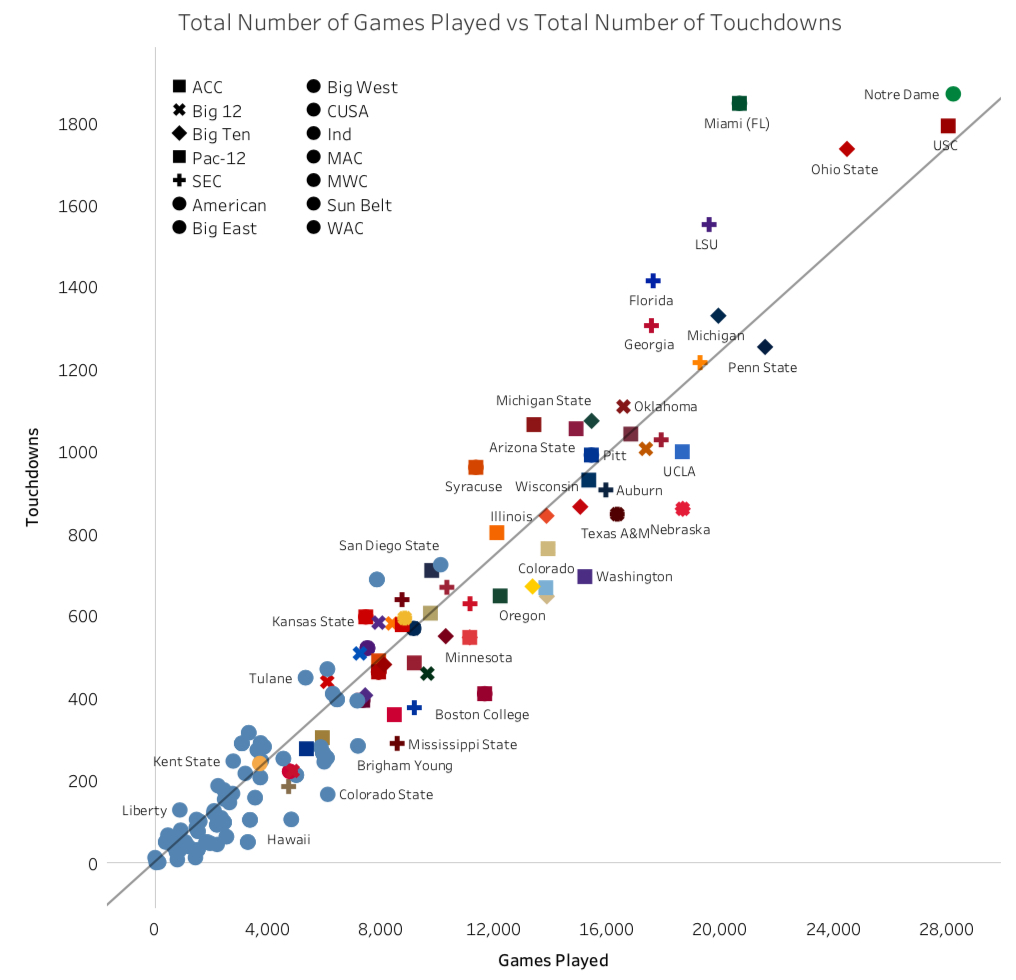
This distribution is much more linear than the last. We still see a large grouping of non power five conference schools around the bottom, but they are around the linear trend line, not just below it.
Miami (FL) easily outperformed all other schools in this measure. They have had 20,656 games played in the NFL and scored 1,848 touchdowns. Having players like Frank Gore certainly helps in this category.
Schools like Washington, Colorado, Penn State, and Auburn all underperform by this measure.
The linear trend line states that it takes (on average) about 17 games by players per school before a touchdown is scored by a player from that school.
Data: https://www.pro-football-reference.com/

0 comments on “Breakdown of NFL Players by College”