

In this weeks post I look at how quarterbacks perform when a defense blitzed or hurried them. Using the passing advanced data available on Pro Football Reference I analyzed the numbers from last season (2018-2019).
To help eliminate noise, I decided to only look at QBs with at least 100 pass attempts and 4 games starts. This post has a measure called “QB Wins”, this is simply a game won for that QB when they started the game.
The first set of graphics are looking at the relationship between the number of times quarterbacks were blitzed and hurried per start and their interception percent.
Every dot is a different quarterback. The color represents their wins per start (dark orange is the best, blue is the worst) and the size of the dot represents the number of QB Wins a quarterback had. To assist with the visual and analysis, I decided to add a linear trend line too.
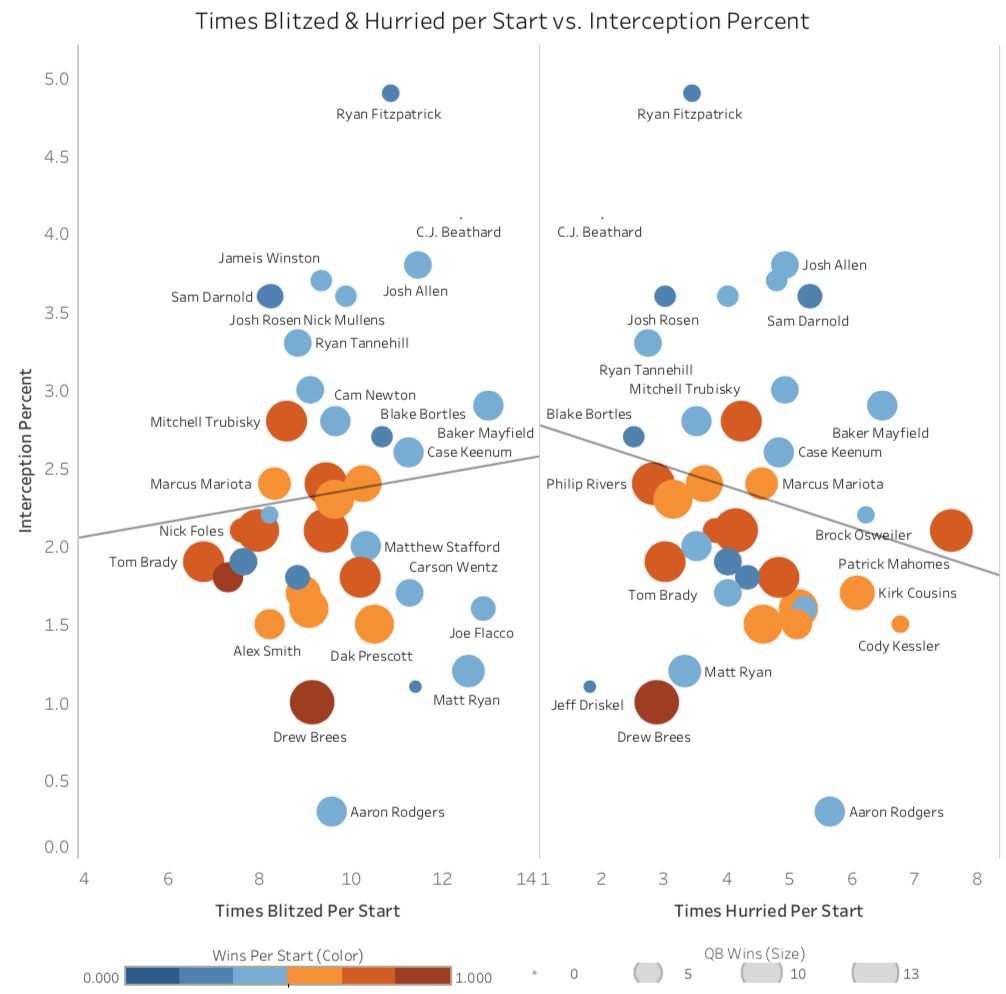
Above we can see that as the blitz per starts increased, so did the quarterback’s interception percent, which is something we would expect to happen. Obviously the point of a blitz is to pressure the quarterback in the hopes they make a mistake. However, when the defense simply hurries the quarterback, we see the interception percent actually decreases.
Last season, Ryan Fitzpatrick had the highest interception percent with 4.9% in his two QB Wins over his 7 starts. Aaron Rodgers on the other hand had the lowest at 0.3%. What’s interesting about these two is they both are in the middle of the pack as far the number of times they were blitzed.
The complete opposite of them would be Baker Mayfield and Tom Brady. Baker was blitzed the most with 13 times a game and had an interception percent of 2.9%. Tom was blitzed the least at only 6.75 times a game and posted an interception percent of 1.9%.
The second graphic is the same as the first, but rather than a sequential color scheme, I split the quarterbacks into two different groups: quarterbacks with less than, and greater than, a .500 QB Win Percent (number of QB Wins divided by number of games started). The orange dots are quarterbacks with greater than .500 QB Win Percent, blue is less than .500.
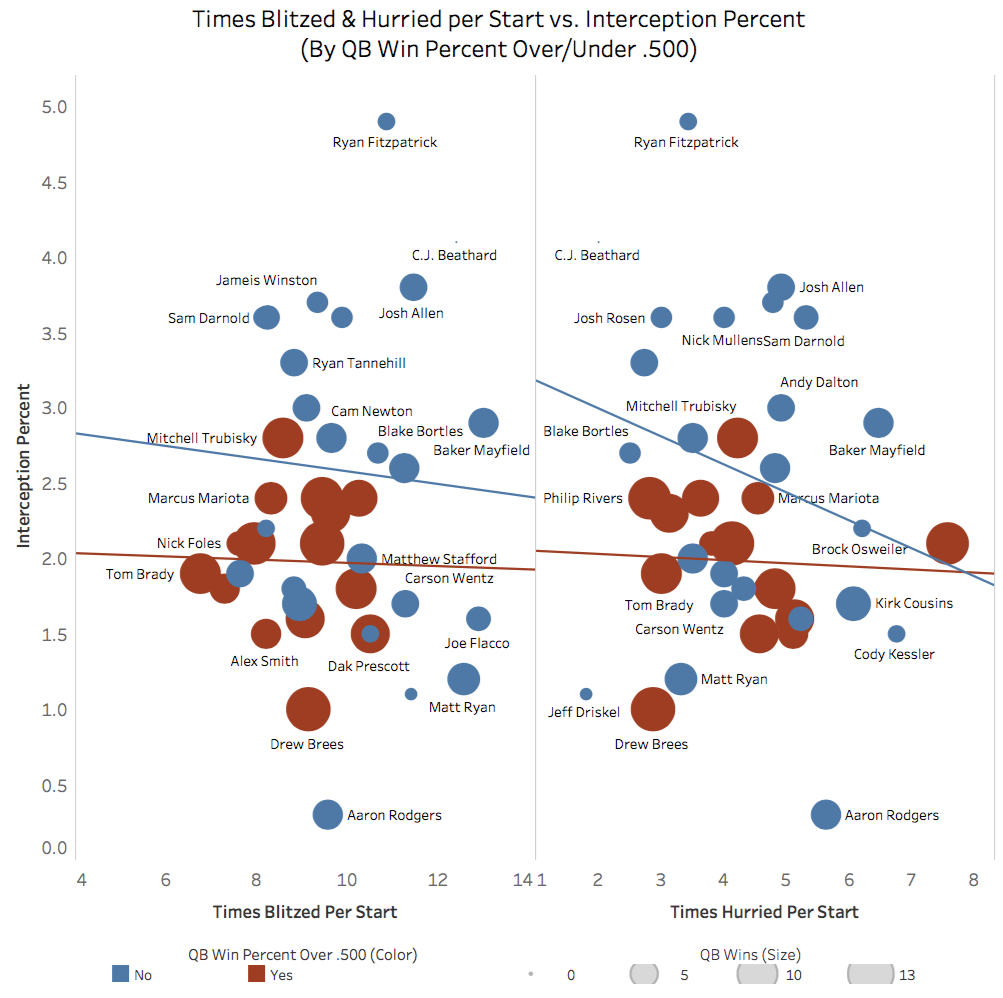
Whats interesting is the linear trend line totally changes. In the first graphic we saw that as blitzes per game increased, so did interception percent. However, now we see interception percent decreasing for both groups of quarterbacks. The story of hurries is the same in this graphic: as hurries increase, interception percent decreases.
The second set of graphics are looking at a quarterback’s bad throw percentage and its relationship with the number of times blitzed and hurried per start. Again, the color represents their wins per start (dark orange is the best, blue is the worst) and the size of the dot represents the number of QB Wins a quarterback had.
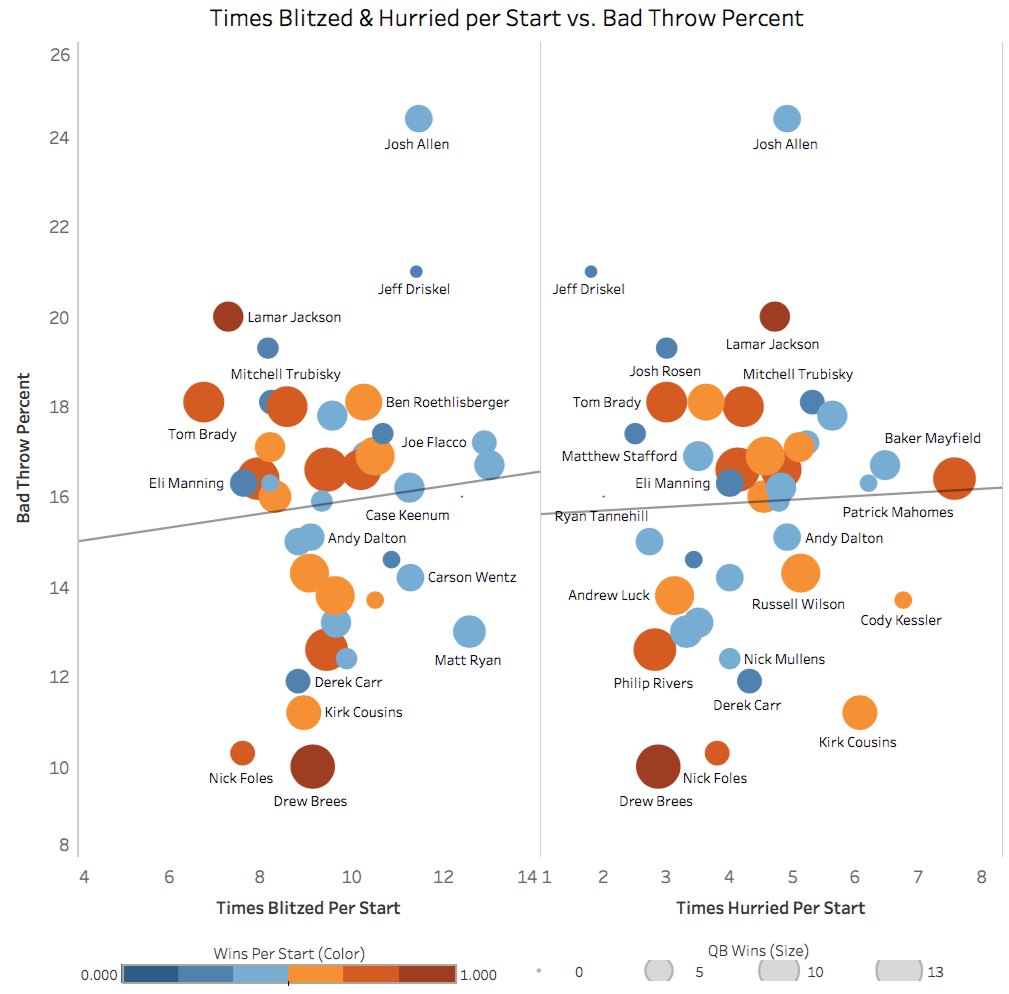
Like with interception percent, a quarterback’s bad throw percent increases as the defense blitz more. However, in this case bad throw percent also increases as the quarterback is hurried more.
Josh Allen of the Buffalo Bills was the worst in this category last year with 24.4% of his passes being “bad”. Drew Brees was the best with only 10.0% of his throws being bad. In the middle of the group was Kansas City’s quarterback, Patrick Mahomes, with 16.4%.
So far this season, Cam Newton and Ryan Fitzpatrick are worst in the NFL with 29.2% and 23.1%, respectively. The best quarterback, with only 3.2%, is Dak Prescott.
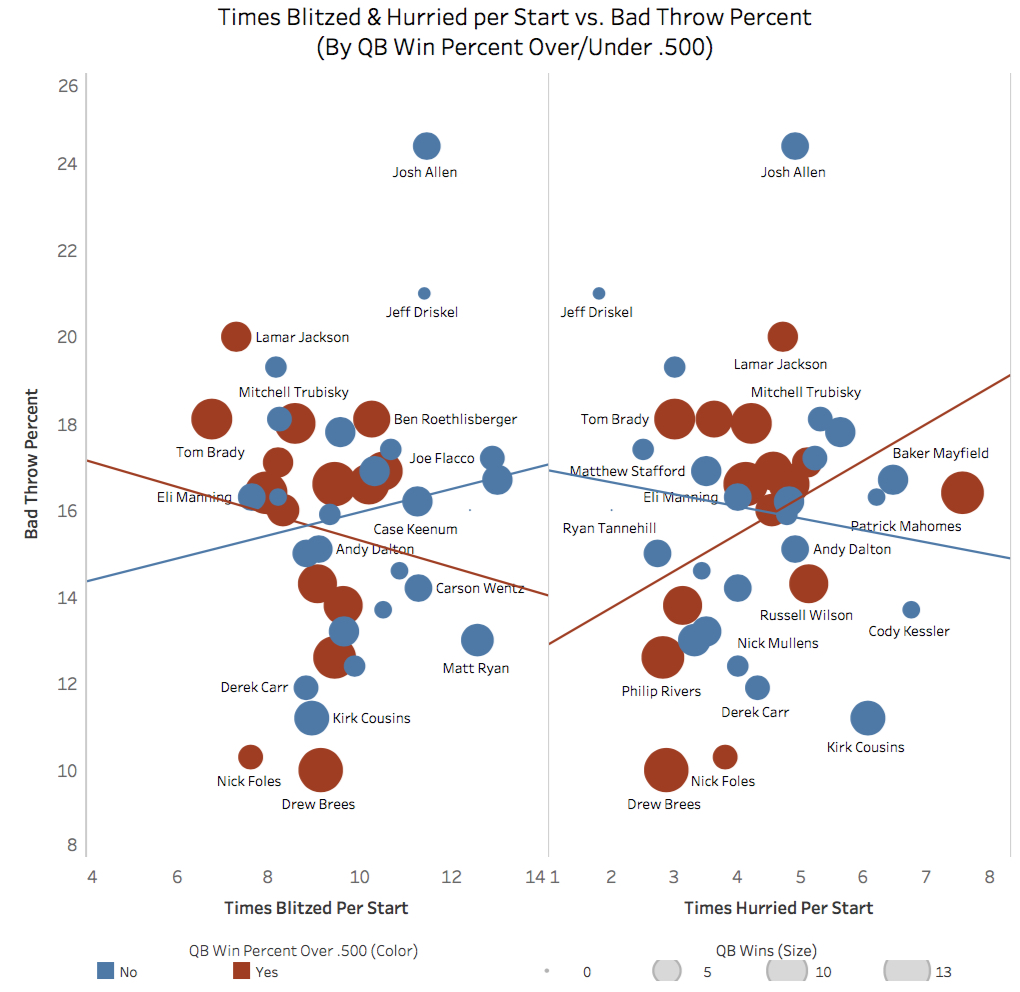
When I separate the quarterbacks into the two win percent groups the story changes again. For blitzes, quarterbacks with a win percent below .500 have a worse bad throw percentage as the number of blitzes increase. This is unlike the quarterbacks with a greater than .500 win percent whose bad throw percent decrease as blitzes increase.
For times hurried it is the exact opposite. Quarterbacks with less than a .500 win percent have less bad throws as they are hurried more, but the better quarterbacks have more bad throws.
So what does all this mean?
It is very telling to me that the narrative changes completely when we separate the quarterbacks into two groups. This suggests that in terms of interception and bad throw percentage, blitzing and hurrying the quarterback is not as significant as one might think.
So should defenses stop? Of course not. While these measures may not show a meaningful relationship, there is certainly an impact. For example: sacks, loss of yardage, or turnovers could all happen when the quarterback is pressured (and really could happen any play). These measures only look at stats where the quarterback threw the ball, which obviously takes away a portion of potential results from a play.
Another, and more nuanced, point of this article is this: don’t take all numbers at face value. It is important to think about more than what you are being shown. From the results above, it would be easy for someone to say “blitzes lead to more interceptions, but hurries don’t” or “defenses should only blitz quarterbacks with a below .500 win percent”, but that would be completely inaccurate and misleading.

*Youre so cool! I dont suppose Ive read anything like this before. So nice to find somebody with some original thoughts on this subject. realy thank you for starting this up. this website is something that is needed on the web, someone with a little originality. useful job for bringing something new to the internet!
LikeLike