

In Part 3 of my multi-part series College Football Conference Comparison, I looked at defense. Part 4 will focus on offense.
The first graphic is showing the average passing yards per attempt per season by conference. Each dot represents a particular season of the conference. The colors of the dots represent the average passing touchdowns the conference as a whole had in a particular season. Additionally, I added in the average passing yards per attempt per conference since the 2000-2001 season.
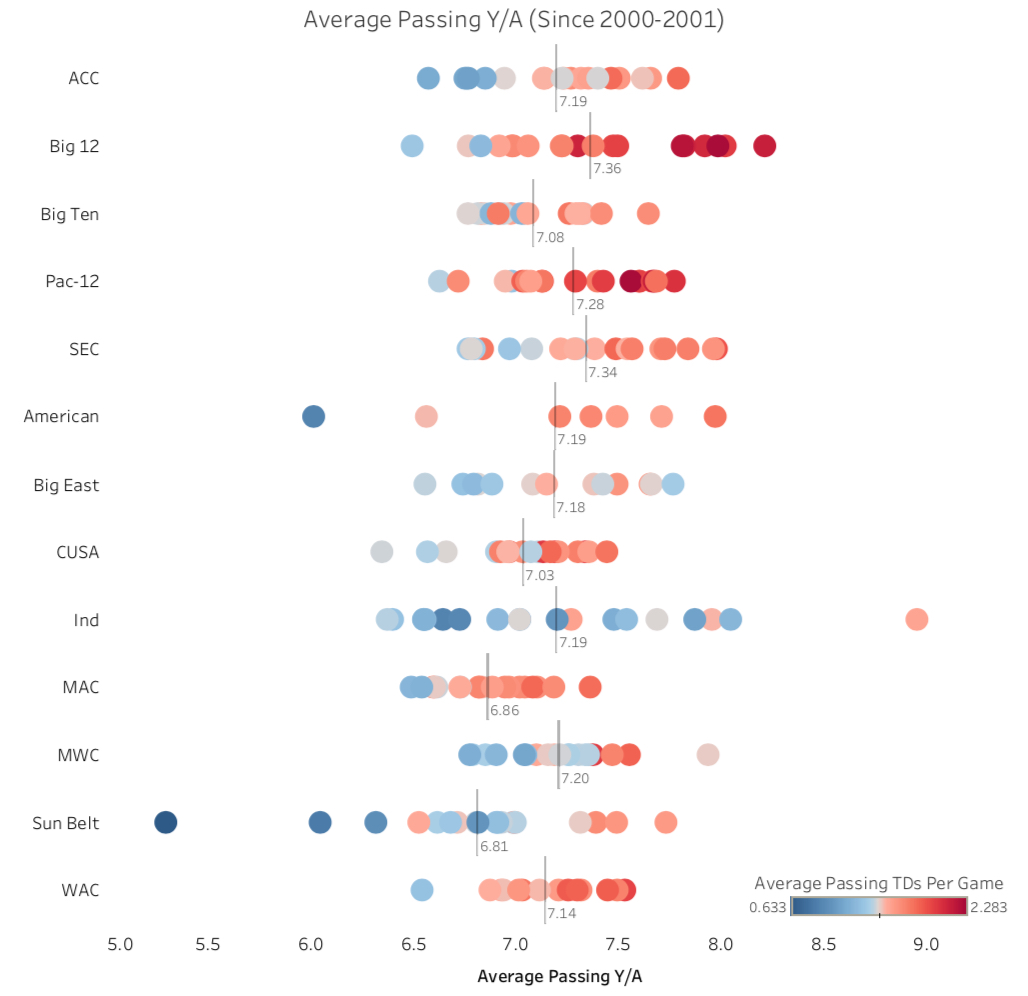
Passing Yards Per Attempt:
The Big 12 leads all other conferences in this metric with an average of 7.36 yards per attempt since 2000. The Big 12 also has a higher concentration of average passing touchdowns per game than most other conferences. The 2008-2009 season had an average of 2.28 passing touchdowns per game.
The SEC was second in this measure with 7.34 yards per attempt. The highest average passing yards per attempt season across all conferences was the 2015-2016 independent schools with 8.95 yards per attempt
The next graphic is comparing the average rushing yards per attempt.
The scatter plot on top has plotted the average rushing yards per attempt and average rushing touchdowns per game by conference and season. The bar chart is showing the average rushing yards per attempt for every conference since the 2000-2001 season.
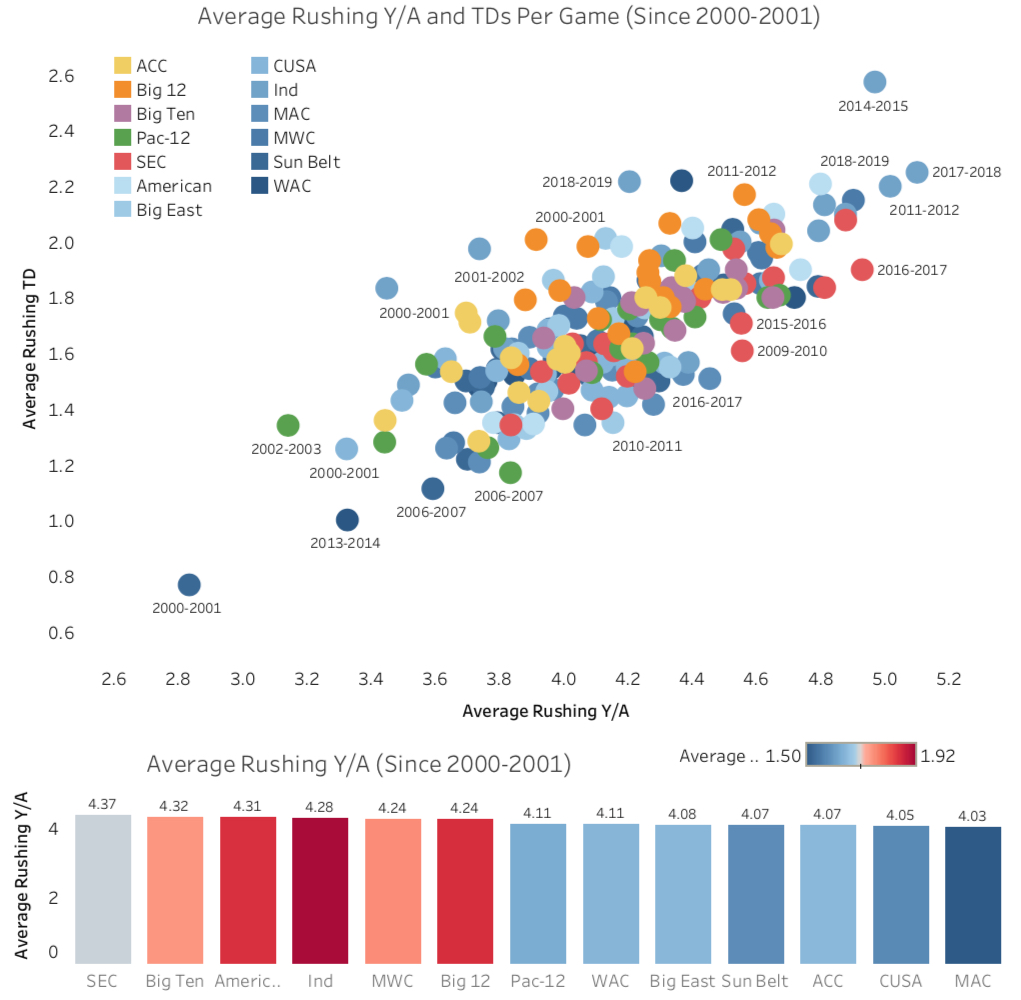
Rushing Yards Per Attempt:
The SEC has the most rushing yards per attempt with 4.37 yards on average. The Big Ten was in second with 4.32 and the American third with 4.31. Of the power five conferences, the SEC has the three highest rushing yards per attempt seasons: 2016-2017, 2013-2014, and 2018-2019 with 4.93, 4.87, and 4.81 Y/A respectively.
The scatter plot clearly shows a correlation between the averaging rushing yards per attempt and the average number of rushing touchdowns per game.
The final graphic shows probably the most important offensive statistic: average points scored. This is broken out by season and conference.
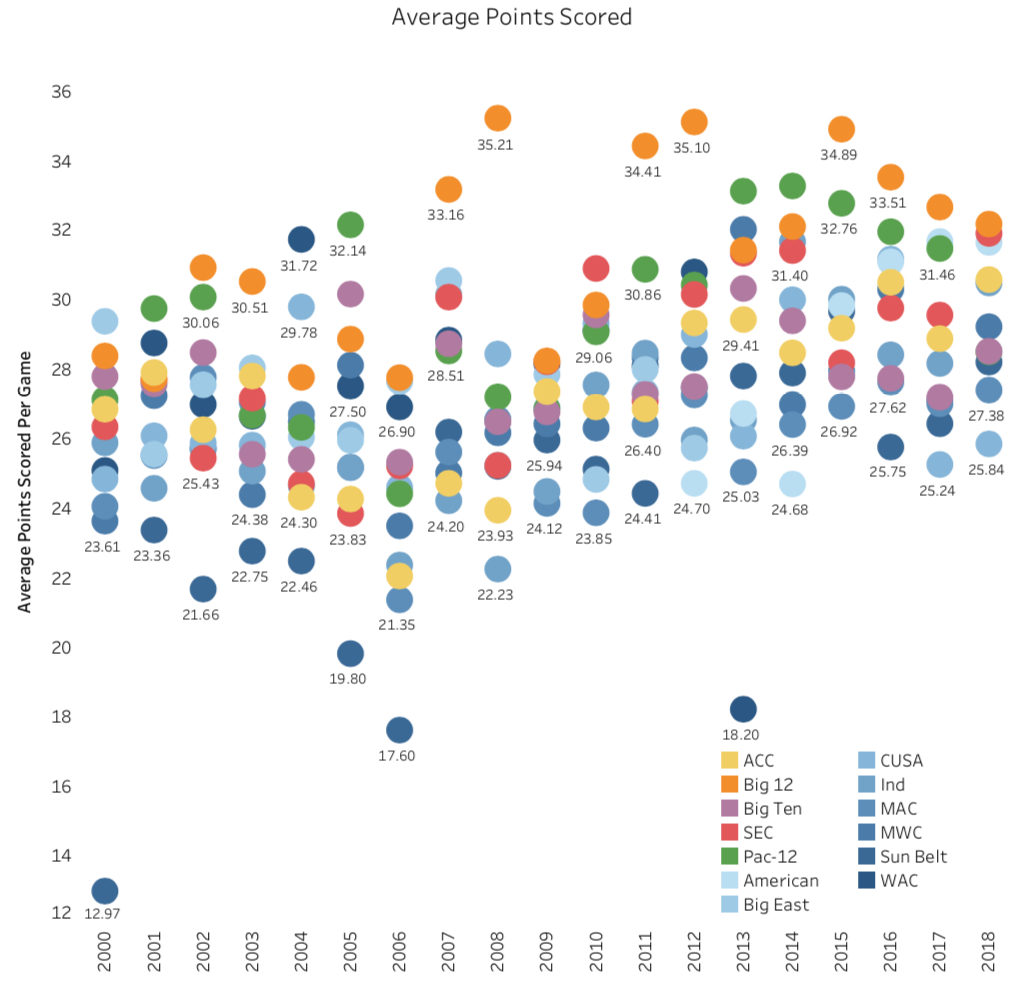
Average Points Scored:
The Big 12 is first in this measure scoring an average of 31.13 points per game since 2000. Second place is the Pac 12 with 29.64 points a game. The Big 12 took the top spot in points scored 12 of the last 19 seasons.
In the 2008-2009 season the Big 12 scored an average of 35.21 points per game, an average of 6.78 points more than the next highest conference (Conference USA). You can see though that in recent years the difference between first and second has diminished. Last season, the SEC scored an average of 31.89 points per game, just .27 points less than the Big 12.
Summary:
Passing Yards per Attempt: Big 12
Rushing Yards per Attempt: SEC
Points Scored: Big 12
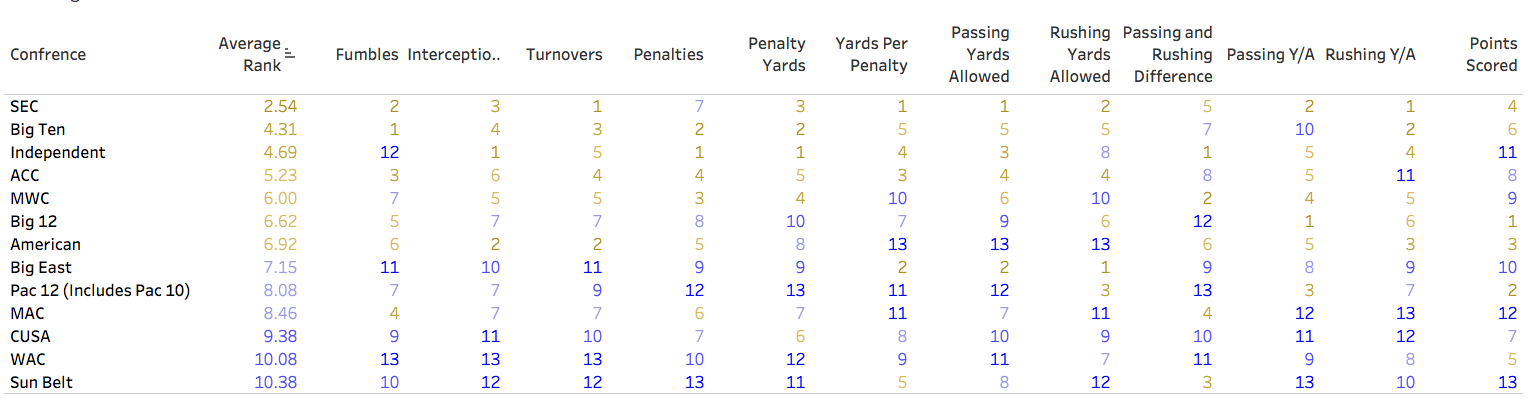
Updated Average Ranking:
1) SEC
2) Big Ten
3) Independent
Intro
Part 1
Part 2
Part 3
Data: https://www.sports-reference.com/cfb/
*All graphics in this post are looking at data since the 2000-2001 season and include the teams in the conferences at that time. So for example, Colorado is included in the Big 12’s rankings until 2010, from there it is included in the Pac 12’s rankings.

0 comments on “College Football Conference Comparison Part 4: Offense”