

With the 2019-2020 college football playoff teams announced, I wanted to look into the four teams to see how they stacked up to all other schools and each other.
The teams this year are:
1) LSU – SEC
2) Ohio State – Big Ten
3) Clemson – ACC
4) Oklahoma – Big 12
While the basic comparisons of each team will be covered, like offensive and defensive stats, the majority of the post will look at some different, less covered, statistics.
Every graphic in this post has the four playoff teams colored as their team color, while all other schools are in a light blue. All graphics are just looking at this past college football season (2019-2020).
The first graphic focuses on offense. Specifically, average yards per play and points scored per game. The linear trend line is included too.

As shown above, the four playoff teams (along with Alabama) are are in a grouping by themselves at the top.
Ohio State, Clemson, and LSU are all above the trend line meaning they score more points on average with less yards per play. Oklahoma is the only playoff team below the trend line.
Ohio State scores the most points per game (48.7) out of any college while Oklahoma had a higher average yards per play (8.2) than any other school.
The second graphic is comparing offensive points scored to defensive points allowed. A 45 degree line is added as well to easily show where teams stand in this comparison. Teams above the line on average score more than their opponents and teams below the line give up more points than they score.

All the playoff teams are grouped in the top left – meaning they score way more than their opponents. Oklahoma allowed opponents to score 24.5 points, the most points of the playoff teams, while Clemson only allowed 10.6.
With players like Jalen Hurts, CeeDee Lamb, Joe Burrow, J.K. Dobbins, Justin Fields, and Trevor Lawrence its not surprising to see these teams put up a lot of points.
The third graphic looks at average yards per penalty.

Interestingly Oklahoma, LSU, and Ohio State are all near the top of the list with 10.53, 9.87, and 9.52 yards per penalty, respectively. On the other hand, Clemson is towards the bottom with only 8.00 yards.
The fourth graphic looks at turnovers; comparing a team’s forced turnovers and turnovers committed. A 45 degree line is added as well to easily show where teams stand in this comparison. Teams above the line commit more turnovers per game than they force (negative turnover margin), while teams below the line commit less turnovers per game than they force (positive turnover margin).
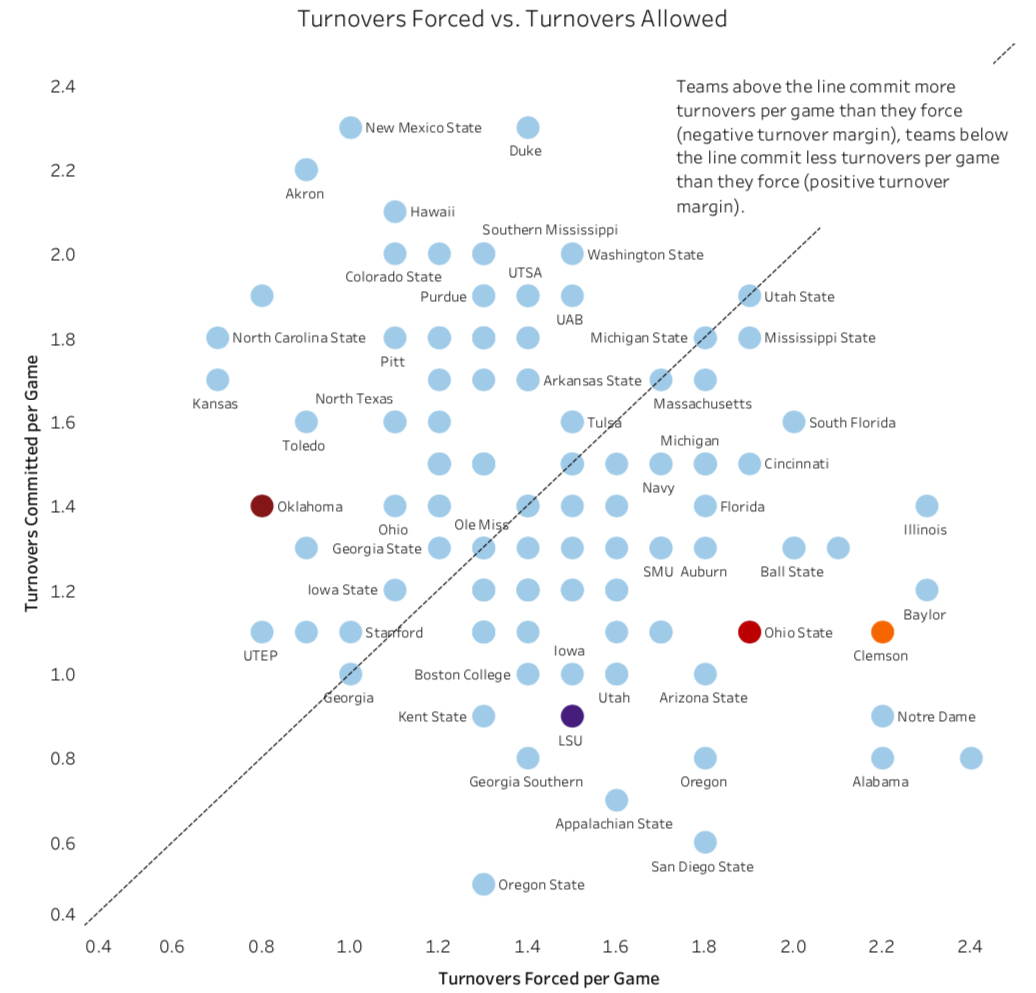
Oklahoma is the only playoff team who commits more turnovers per game than they force. On average, Oklahoma forces .8 turnovers and commits 1.4 per game.
Clemson is the best in this measure. They force 2.2 turnovers a game while they only commit 1.1 turnovers (same as Ohio State). LSU is by far the “safest” of the four; forcing 1.5 turnovers and committing only .9.
The final graphic looks at non-traditional ways teams get, or give up, first downs – that is by penalties. A 45 degree line is added as well to easily show where teams stand in this comparison. Teams above the line get more first downs from opponent penalties than they give opponents from penalties. Teams below the line give more first downs from penalties than opponents give them from penalties.

Clemson and Ohio State are above the 45 degree line, while Oklahoma and LSU are below it.
Oklahoma is the worst in this measure. They give up 2.7 first downs from penalties while they only receive 1.0 first down from opponent penalties per game.
Ohio State gets 2.3 first downs a game from opponent penalties and Clemson only gives opponents 1.1 first downs from penalties per game.
All these teams can score and all are fairly even defensively. Because of this, winning or losing often comes down to other aspects of the game. When thinking about these teams matching up one should consider the other measures we looked at.
Some things to remember:
Clemson has one of the lowest yards per penalty of any NCAA team this season. Oklahoma, Ohio State, and LSU have some of the highest.
Oklahoma commits the most turnovers per game and forces the fewest.
Oklahoma gives up the most first downs from penalties.
LSU is not the best or worst in any of the measures we looked at.

Pingback: 2019-2020 NFL Playoffs Preview – The Commute Sports