

While the Stanley Cup Playoffs are still over a month away, and a lot could still change as far as what teams are in the playoffs, I decided to look at where teams currently stand and how they compare to other teams in the past six seasons. I’ll make some (way too early) predictions too, which will probably end up being wildly wrong, but are fun none the less.
First will be my prediction of what teams make the playoffs, next will be a look into where teams stand compared to historical teams, and finally my pick of who will win the Stanley Cup.
As of 3/1/2020, the Stanley Cup Playoff picture looks like:

The colors represent the rankings of the teams. The top three teams in each division get into the playoffs as well as two wildcard teams from each division – totaling 16 teams total.
My predictions for the Eastern Conference playoff teams are:
Atlantic:
1) Boston Bruins
2) Tampa Bay Lighting
3) Toronto Maple Leafs
Metropolitan:
1) Washington Capitals
2) Pittsburg Penguins
3) Philadelphia Flyers
Eastern Conference Wildcard:
1) New York Islanders
2) Carolina Hurricans
Some small switching between teams in the Metropolitan Division as far as seeding goes and I believe the Columbus Blue Jackets will fall out of contention and be replaced by the Carolina Hurricanes.
My predictions foe the Western Conference playoff teams are:
Central: (unchanged from current)
1) St. Louis Blues
2) Colorado Avalanche
3) Dallas Stars
Pacific:
1) Vegas Golden Knights
2) Edmonton Oilers
3) Calgary Flames
Western Conference Wildcard:
1) Vancouver Canucks
2) Nashville Predators
I think the Vancouver Canucks fall into a wildcard spot and the Nashville Predators make a move up into the final spot. I think the Minnesota Wild actually make a move towards the end of the season and will be in that wildcard spot for a day or two, only to fall out and miss the cut this year. The Western Conference currently has 6 teams within 8 points of the top wildcard spot.
The next graphic looks at teams power play percentage stats, that is penalty kill percentage and power play success percentage. The teams shown are from 2014-2015 season through the current season. The color of the teams represent if they made the playoffs that given year. Orange represents the current season teams.

The Edmonton Oilers are at historic levels along with last years Tampa Bay lighting, who had an absolutely shocking playoff performance. The Toronto Maple Leaves are being scored on 23% of the time, which is well below the average. The Nashville Predators are again terrible in power plays, scoring only 16% of the time. I think they yet again they will be knocked out of the playoffs in the first round. Successful teams in playoffs have good power plays and the Nashville Predators do not.
The third graphic looks at teams’ PDO, which is the sum of their save and shooting percent. It can be used as an indicator of how lucky a team is. The color of the shapes represent the teams’ PDO, while the shape represents if they made the playoffs or not.
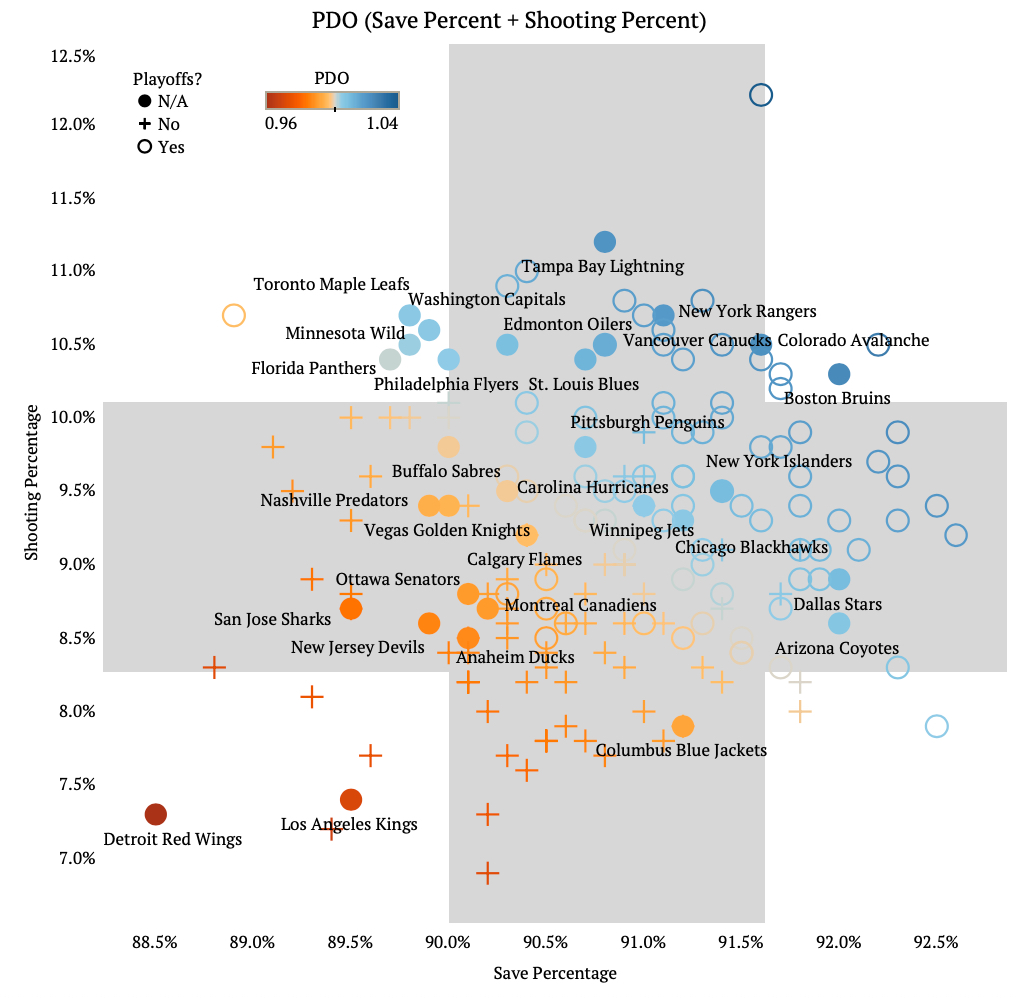
The Boston Bruins, Colorado Avalanche, New York Rangers, and Tampa Bay Lighting are four very luck teams this season, having a high save and shooting percentage. All but the Rangers are teams I believe make they playoffs.
The grouping of Toronto, Minnesota, Washington, Philadelphia, and Florida is interesting. There have not been any other teams since 2014-2015 with a similar combination of save and shooting percentage, and this season there are five.
The next two graphics looks at goal for and goal against stats. The first looks at a teams goals for and goals against while the second looks at even strength goals for per game and total goals per game. Again, the colors represent if that team made the playoffs or are currently playing.

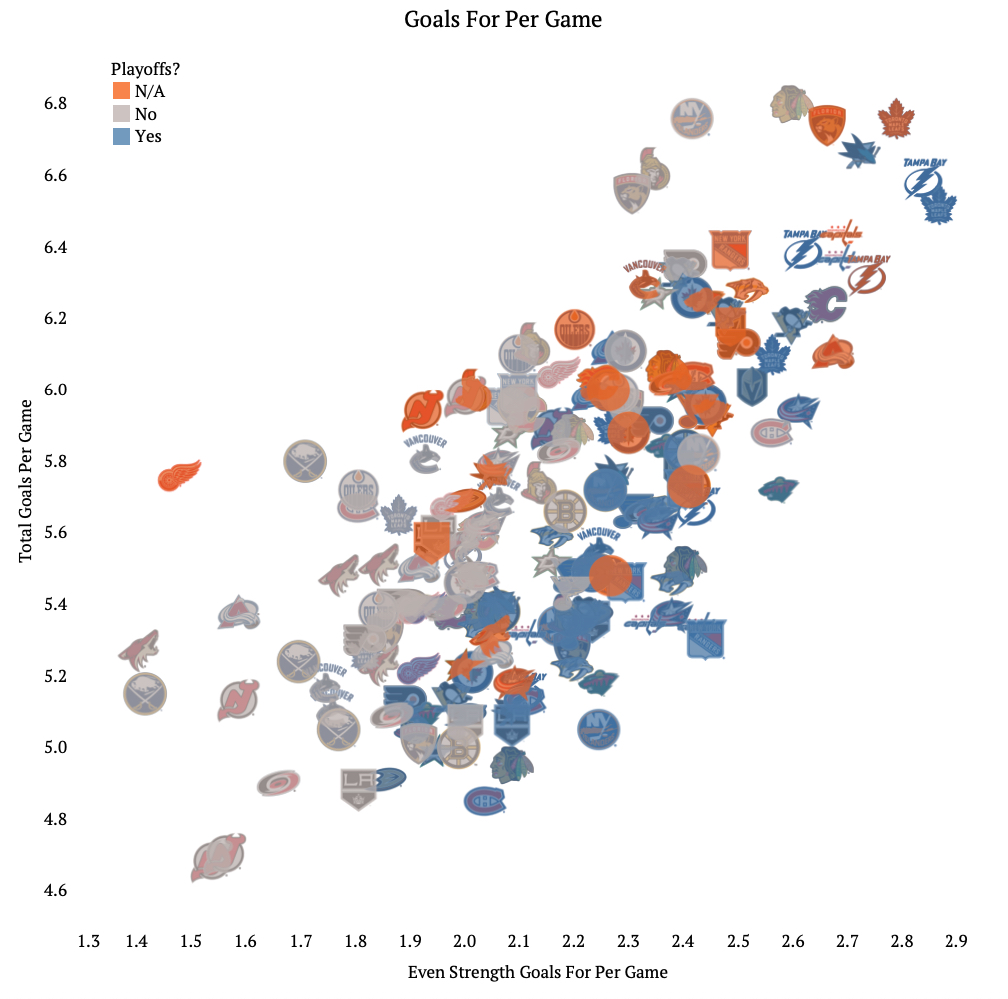
The Boston Bruins have a historically great goals for/goals against ratio scoring almost 3.3 goals a game and allowing only 2.4 a game. The only other playoff team outside of the standard deviation bands are the Toronto Maple Leaves who score 3.5 goals a game, but also allow 3.2.
It is clear from the final graphic that teams who score more even strength goals usually make the playoffs, but one big exception to this is the Florida Panthers who currently are on the outside looking in.
This graphic does a great job showing how poor the Detroit Red Wings are this season. They score about 1.45 even strength goals a game, but have a total goals per game number of around 5.8.
At the time of writing this I predict the Edmonton Oilers will win the Stanley Cup. As we have seen, they have a historically great power play unit and they are towards the top of PDO this season. Although they are below average in even strength goals per game and their goals for/goals against ratio is nothing to write home about I think their offensive capabilities and their decent defense will bring them a long way into the playoffs and ultimately allow them to win. Not to mention they have one of the quickest lines in the NHL and arguably the MVP of the season with Leon Draisaitl.

0 comments on “Stanley Cup Playoff Predictions”