

After my last article on the importance of free throws a friend of mine suggested looking at free throw importance at an individual game level, so that’s what I did. If a team shoots more free throws than their opponent are they more likely to win the game?
This post will be the first of a two part series on predicting NCAA Mens Basketball games. I’m using individual game data from the 2019-2020 season for all division one teams.
The first graphic looks at the percent of games won based on the free throw attempt +/- (FTA+/-), that is the team’s free throw attempts minus their opponent’s free throw attempts.
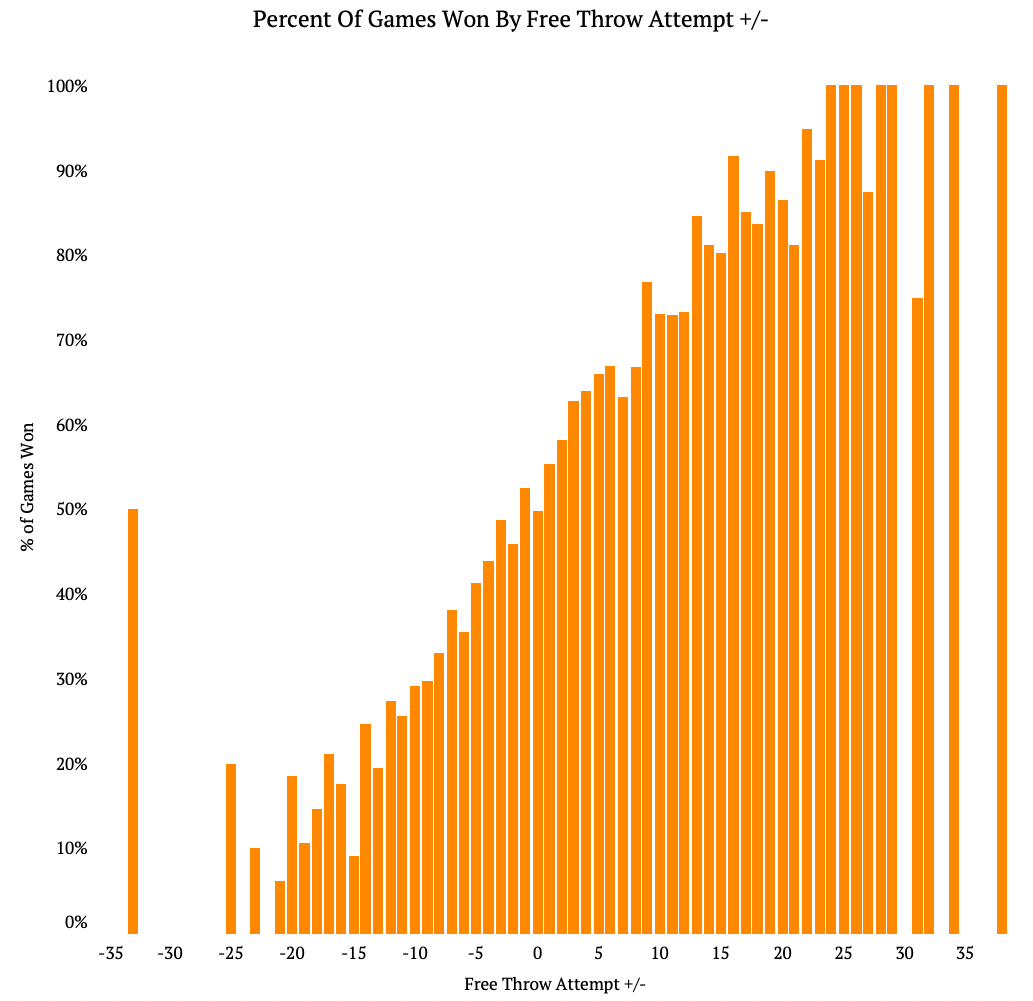
The large majority of games won were when teams had a positive FTA+/-, but there clearly games won with a negative FTA+/-. About 60% of games were won by the team if they had 5 more free throws than their opponent and that jumps to 70% of games won when a team had about 10 more free throws than their opponents.
The second graphic is a histogram of all the games won and loss by FTA+/-.
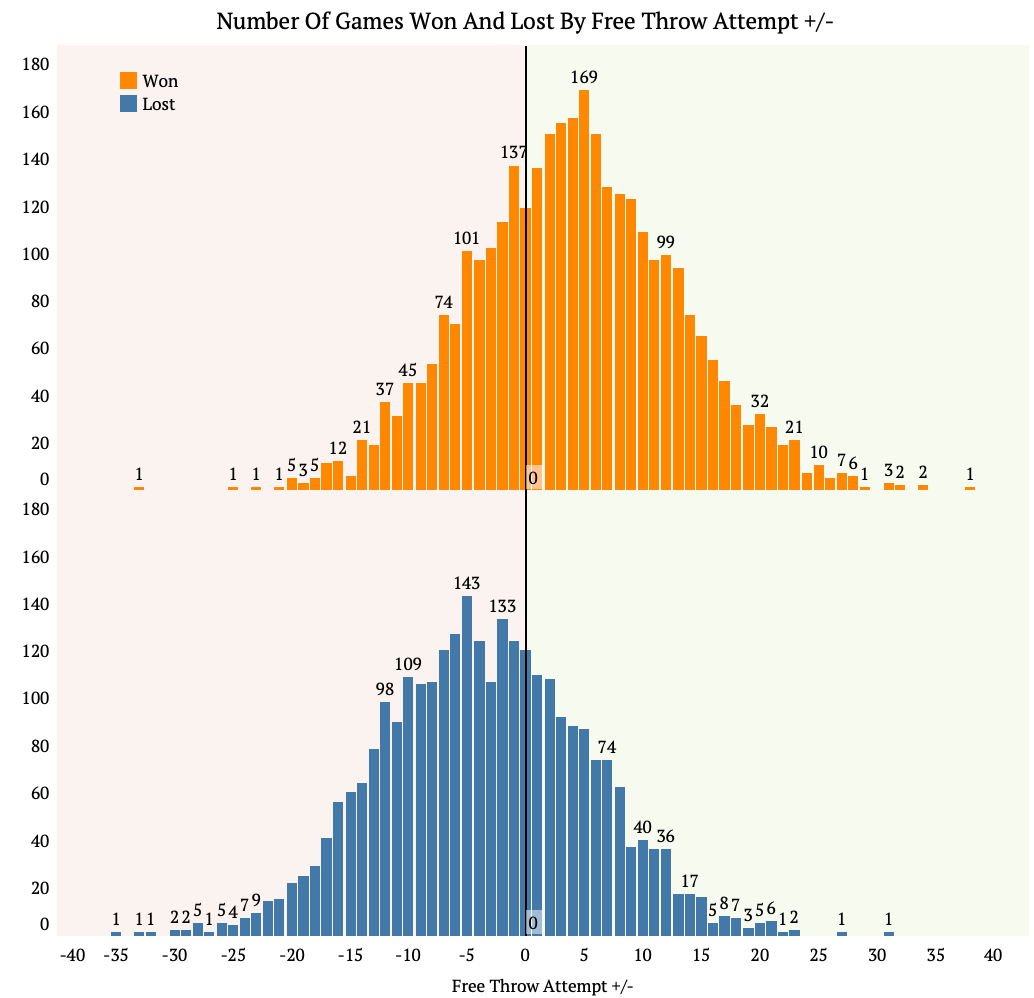
It’s clear again that teams win more often when they have a positive FTA+/-, but there are clearly some outliers. For example, there was one game this past season where a team won the game while having a -33 FTA+/-. Conversely, there was one game where a team lost while having a +31 FTA+/-. While these clearly are the exceptions and not the rule, there is definitely not a clear FTA+/- number that secures the games outcome.
While the graphics help us see the relationship between wins and FTA+/-, it does not explicitly say if there is a true relationship there – we need statistics for that.
To bridge this gap I ran a logit regression with the individual game data in python to help see how accurate FTA+/- would be at predicting if a team wins or loses – turns out its not too bad. In fact it will correctly pick if a team wins or loses 66% of the time based only on FTA+/-.
For example:
The model would correctly predict a team with a FTA+/- of +14 to win 79.95% of the time.
The model would correctly predict a team with a FTA+/- of -15 to win 18.51% of the time.
However, the predictions get less accurate in the middle of the FTA+/- range. The model would correctly predict a team with a FTA+/- of 2 to win 54.92% of the time, which is not much better than a coin flip. We saw in the graphic above that lots of teams still lose even if they have a FTA+/- of 2.
So while FTA+/- is an okay predictor of wins there are other stats that do a much better job.
Let’s look at a team’s field goal percent, certainly that helps determine if a team will win or not. The below graphic separates games by wins and losses based on their field goal percent. The size of the circle means more games also had that same field goal percent. For example, last season 164 games were won with a field goal percent of 50%.

It’s very apparent that teams usually win if they have a good field goal percent. The average field goal percent of games lost this past season was only 39.23% while the average field goal percent of games won was 49.17%.
So what happens if we use both FTA+/- and field goal percent to predict the outcome of the game?
The final graphic shows outcomes of this season’s games based on FTA+/- and field goal percent. The size of the dot represents the number of games with that particular combination of FTA+/- and field goal percent. The color of the circles represent if the game was won or lost.

Teams with higher FTA+/- and field goal percent generally win games, but there’s still some overlap between the winners of games and the losers of games.
When using both FTA+/- and field goal percent the model will pick games correctly 79% of the time.
Using the same real game examples as before:
The model will predict a team with the a FTA+/- of +14 and field goal percent of 57.6% to win 85.13% of the time.
The model will predict a team with the a FTA+/- of -15 and field goal percent of 28.4% to win 21.46% of the time.
The model will predict a team with the a FTA+/- of +2 and field goal percent of 46.8% to win 62.11% of the time.
What’s interesting about these examples is the last one. In both cases, the model would more often than not say that team will win. However, that particular game was actually lost by the team.
It’s apparent that this model does a good job predicting at the extremes, but can we get it to get better at accurately predicting outcomes in the middle? That is what we will look at in part 2 of this series. I’ll be adding more variables to hopefully predict games more accurately.

Pingback: Predicting College Basketball Games (Part 2) – The Commute Sports
Pingback: Predicting NHL Hockey Games – The Commute Sports