

This article is the second of a two part series on predicting college basketball games. In Part 1 of the series I looked primarily into whether or not a team’s Free Throw Attempt +/- (FTA +/-) was a good indicator of a team’s success.
In this article we will add other in-game statistics in an attempt to provide even more accurate game predictions.
As in part 1, I’m using individual game data from the 2019-2020 season for all division one teams.
To start, I thought it would be interesting to look at a team’s turnover +/- (TOV +/-) to see if that makes our prediction model more accurate. A team’s TOV +/- is the opponent’s number of turnovers – school’s number of turnovers. For example: say a team has 10 turnovers, but their opponent has 8, then the team’s TOV +/- would be -2.
A histogram of TOV +/- gives a good picture on if it would be useful at predicting wins. The below graphic shows the number of games won and lost last season based on the unique TOV +/- values. Average lines for both wins and losses have been added.
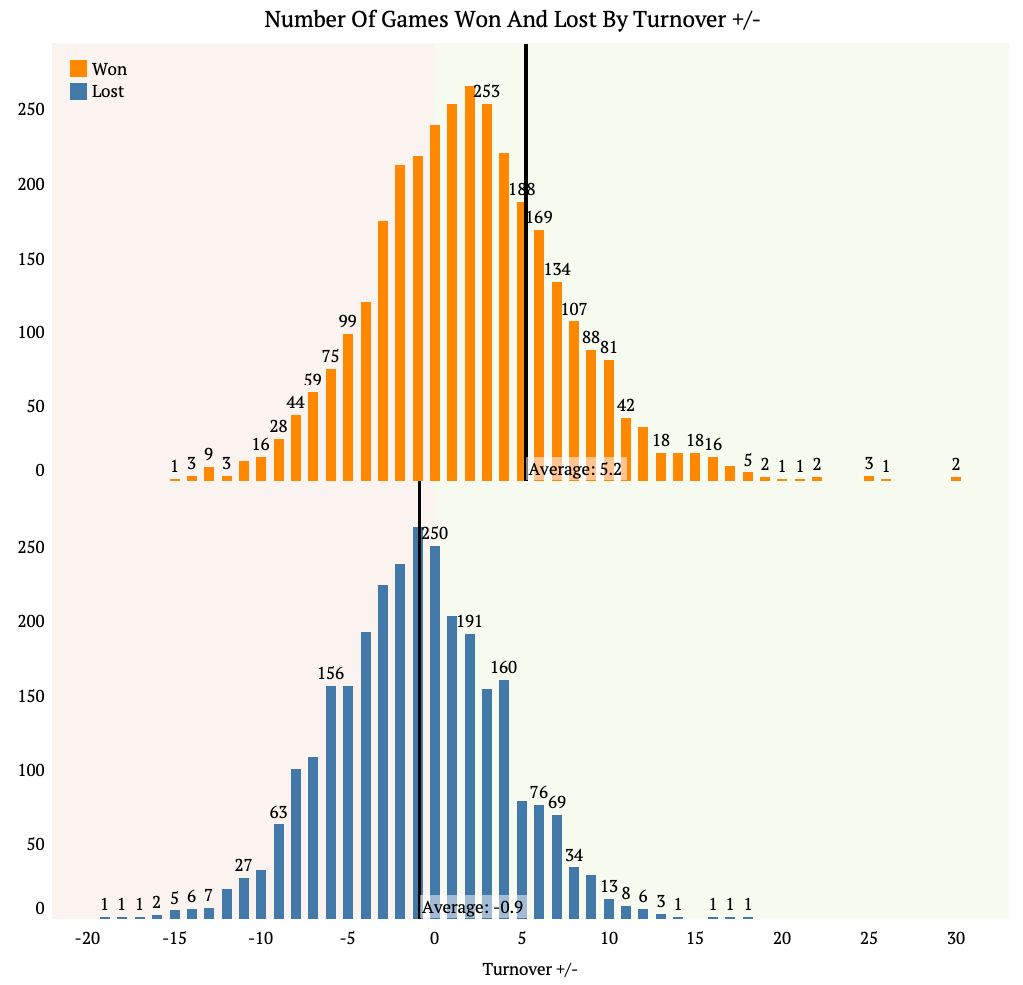
The average TOV +/- for games won was +5.2 while the average for games lost was -0.9. What’s interesting about this is for the games won, the margin is large, but for games lost it is essentially only a difference of 1. This suggests that while the TOV +/- could be important, it may not make a large difference unless it is around +5.
It’s certainly worth pointing out too the large amount of overlap between the wins and losses. Plenty of teams won and loss while having a TOV +/- from about -6 to +10. So similar to FTA +/- in part 1, there is not clear cut line where TOV +/- secures a win.
One of the major issues of using TOV +/-, FTA +/-, and field goal precent in predicting games is it doesn’t exclusively take the the other team’s performance into consideration: opponent field goal percent does. This should be a good predictor to add to the model.
The below graphic separates games by wins and losses based on their opponent’s field goal percent. The size of the circle means more games also had that same field goal percent. For example, last season 155 games were lost with an opponent field goal percent of 50%.
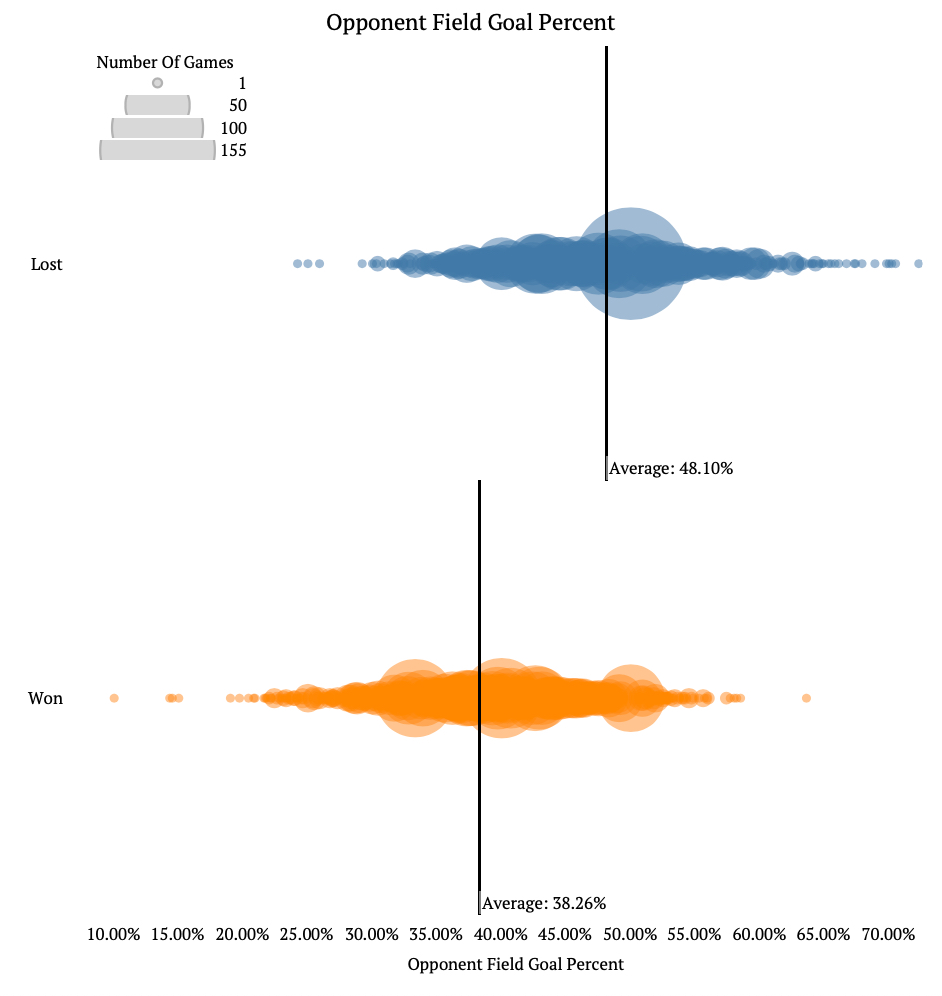
The above graphic shows what one would expect – teams generally win when their opponent has a lower field goal percent. On average, the opponent’s field goal percent for winning teams was 38.26% while for teams that lost it was much higher at 48.10%.
When we visualize wins and losses by TOV +/- and opponent field goal percent we get the below graphic. The size of the dot represents the number of games with that particular combination of TOV +/- and opponent field goal percent. The color of the circles represent if the game was won or lost.
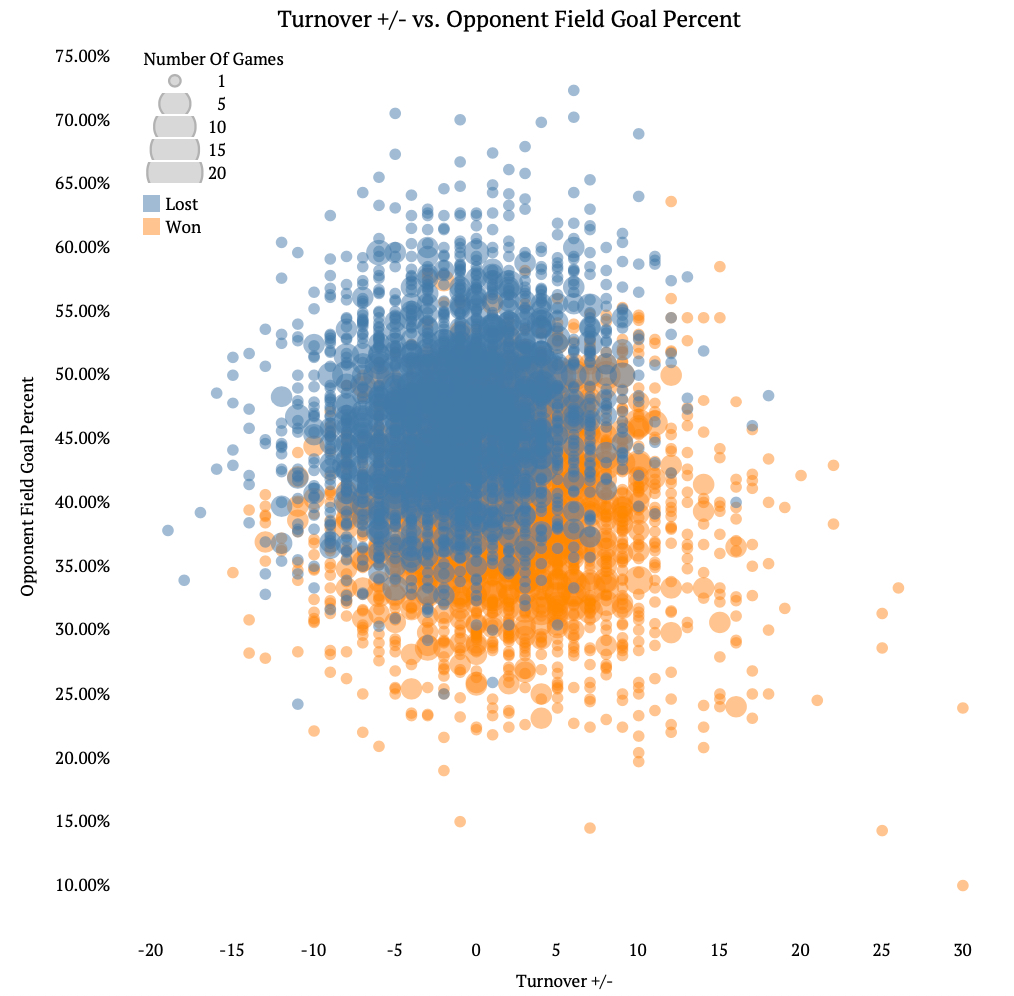
There are the two clear groupings of wins and losses. As expected, teams with a larger TOV +/- and lower opponent field goal percent generally win the game (shown in the lower right side of the plot) while teams with a smaller TOV +/- and higher opponent field goal percent generally lose the game (shown in the upper left side of the plot).
The problem we still see though is the large amount of overlap between wins and loses. For example if a team had a TOV +/- of 0 and an opponent field goal percent of 40%, that could be classified as either a win or loss.
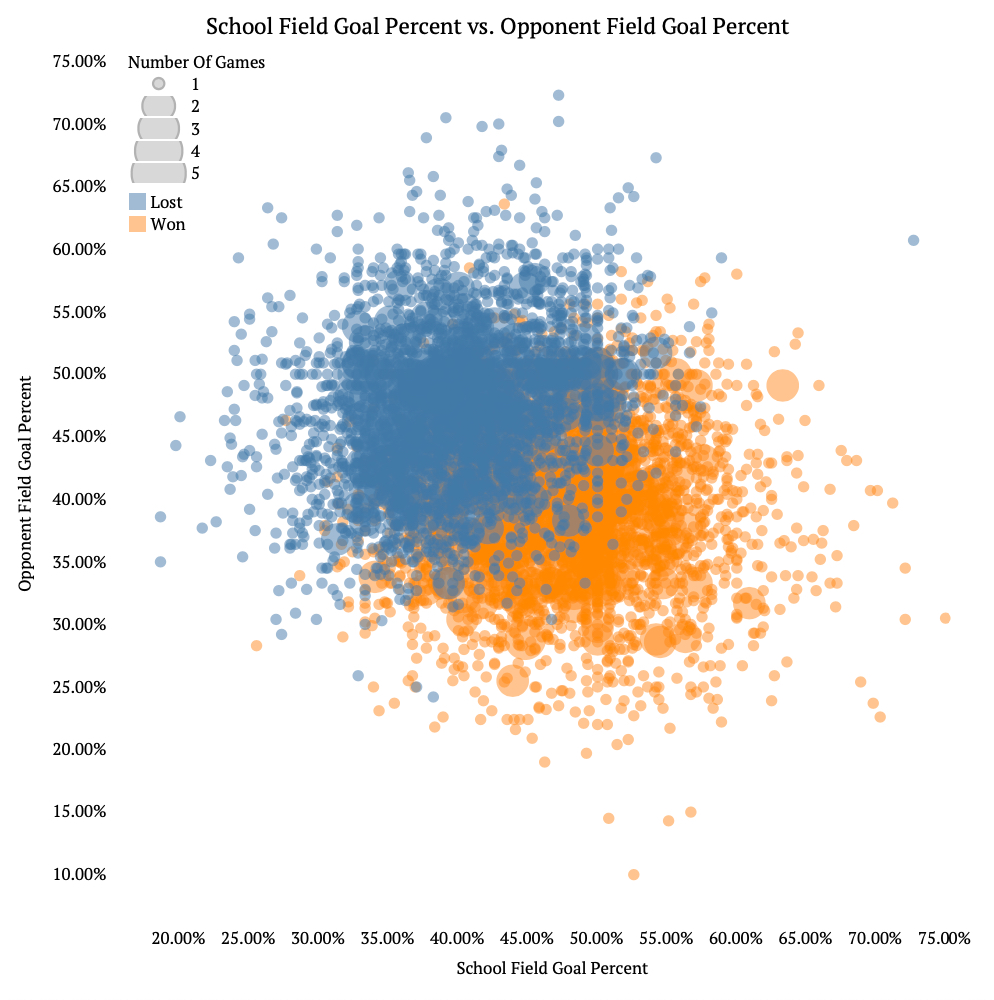
Visualizing school field goal percent with opponent field goal percent gives us a similar picture – still a lot of overlap between wins and losses.
But what does the model make of all this? If we were to use FTA +/-, school field goal percent, TOV +/-, and opponent field goal percent all to predict wins and losses, how accurate would we be?
Using these variables the model would be accurate 89% of the time, which is much higher than the models in part 1 which were accurate 66% and 79% of the time.
Lets look at the same examples we used in part 1, but adding in the TOV +/- and opponent field goal numbers for those games.
Game 1:
FTA +/- of +14
Field Goal Percent of 57.6%
TOV +/- of 2
Opponent Field Goal Percent of 43.5%
The model would predict this game to be won 99.83% of the time.
Game 2:
FTA +/- of -15
Field Goal Percent of 28.4%
TOV +/- of -4
Opponent Field Goal Percent of 46.2%
The model would predict this game to be won 0.008% of the time
Game 3:
FTA +/- of +2
Field Goal Percent of 46.8%
TOV +/- of -2
Opponent Field Goal Percent of 47.9%
The model would predict this game to be won 34.76% of the time
We see from above that games 1 and 2 are clearly going to be won or lost by the teams, this is similar to both the other models in part 1. However game 3 is a different story. If you recall the two models before classified game 3 as a win, even though this game was lost by the team in real life. The third model, which includes all the variables, is the only one to correctly classify this as a loss.
This is important because it shows how much more accurate the model can become at predicting games when you include more variables in it which significantly impact the outcome of the basketball game.
I really enjoyed looking into this the past few weeks and plan on doing this in the future with other sports.
Do you like these multiple part series and topics, or have suggestions on future posts? Let me know! Leave a comment or email me though the contact page.

Pingback: Predicting NHL Hockey Games – The Commute Sports