

With the third article on expected points added (EPA) I wanted to look at how teams compare to one another in specific situations within a football game.
For more information on EPA, visit my introduction article, or my second EPA article for more details.
All data in this post is from the 2019 regular season.
The first two graphics will look at how team’s EPA compare to one another when a team decides to run the ball on third and long. The first graphic shows average EPA per rush attempt on 3rd and 7+ yards to go while the second graphic shows average EPA per rush attempt on 3rd and 10+ yards to go.
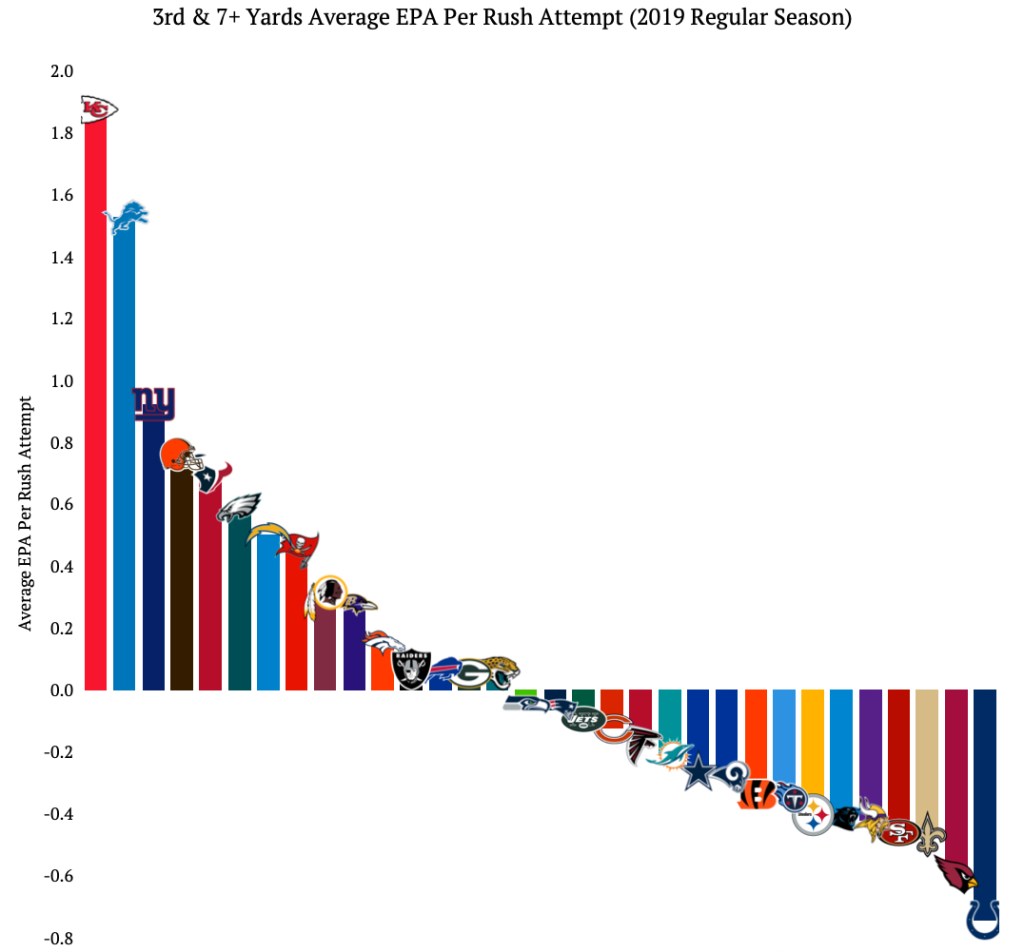
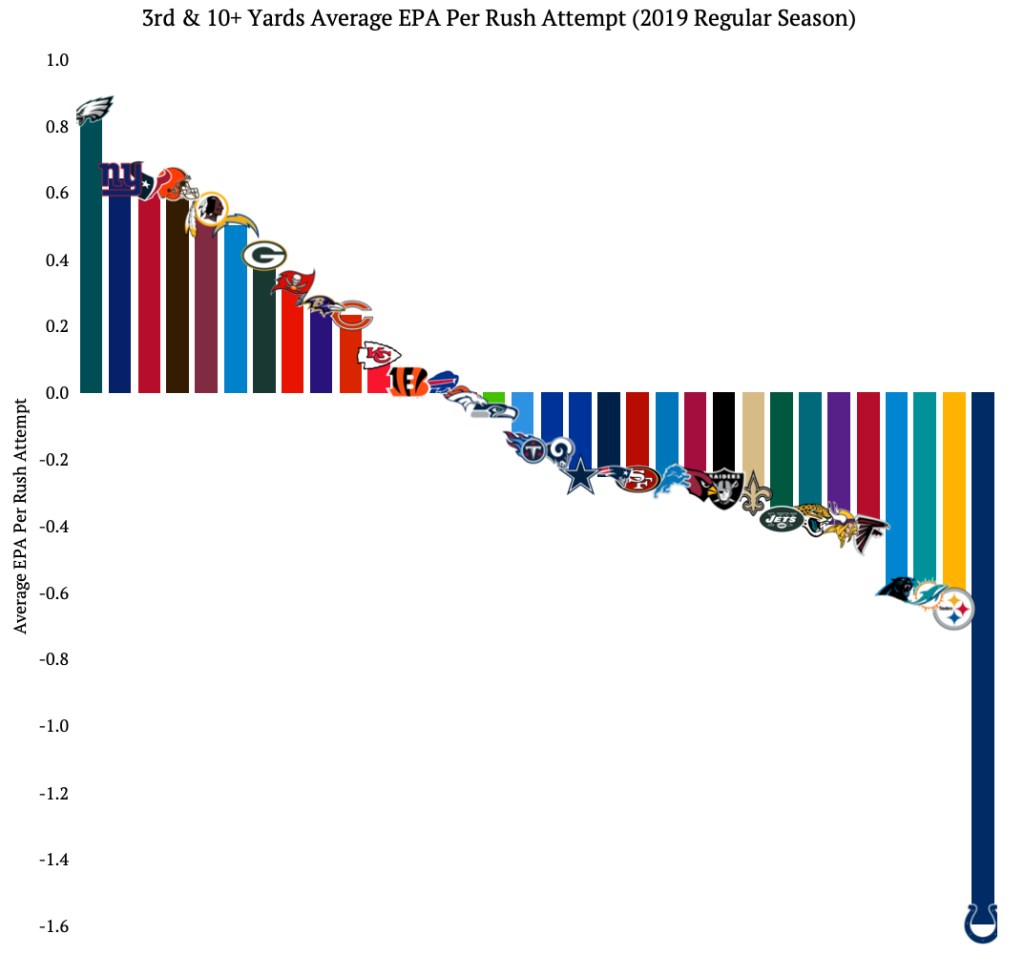
The Indianapolis Colts were not good running the ball on 3rd and long situations last season. Averaging about -.8 EPA on 7+ yards and about -1.6 EPA on 10+ yards.
Most of the teams with positive EPA per rush attempts on 7+ yards continued to be positive when faced with 10+ yards as well, which one would expect. The order of the teams did change though.
On 3rd and 7+ yards the Kansas City Chiefs were by far the best team by the EPA per attempt measure. They had almost .4 more EPA than the second place Detroit Lions. The decrease in EPA amount between 7+ and 10+ yards to go is apparent – the amount the average team is positive is much smaller. This just goes to show how much of a difference 3 yards can make.
The next two graphics are similar to the first two, but rather than average EPA per rush attempts, they look at average EPA per pass attempts on 3rd and long situations. Again, the first graphic is 3rd and 7+ yards to go and the seconds is 3rd and 10+ yards to go.
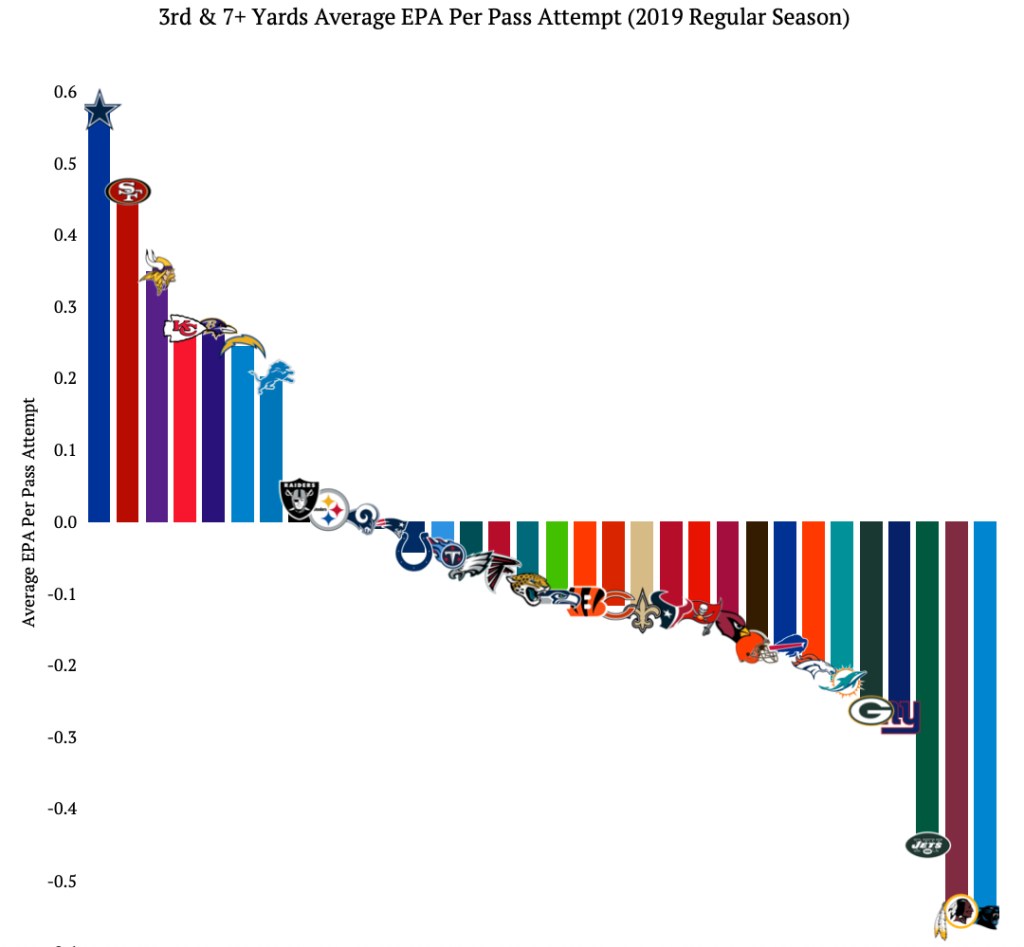
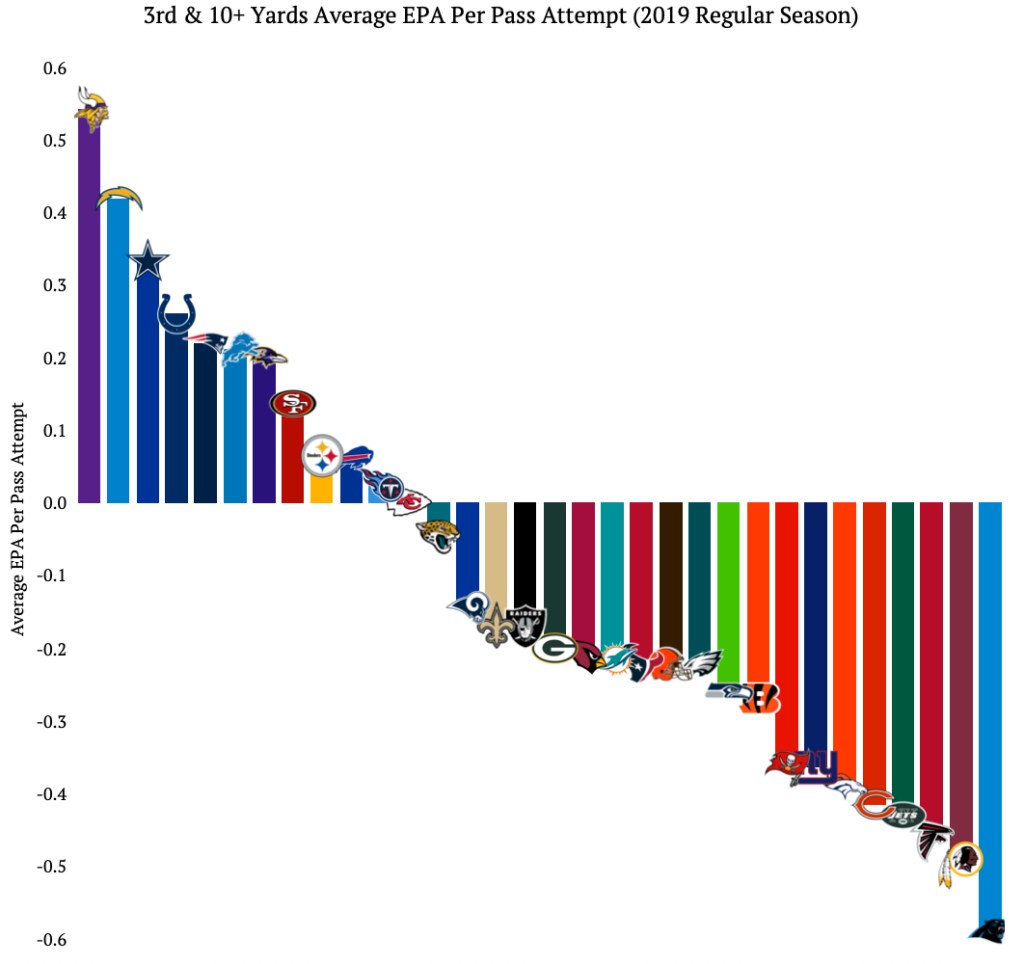
The Dallas Cowboys took the top spot on 3rd and 7+ yards while the Minnesota Vikings were the best at 3rd and 10+ yards. What’s interesting between these two graphics is that more teams averaged a positive EPA per pass attempt on 3rd and 10+ then 3rd and 7+ – to me this shows how explosive a team’s offense can still be even on a 3rd and 10+.
The makeup of the positive teams is interesting too. While you see some very good teams from last season (Kansas City, Baltimore, San Francisco), you also see some bad teams (Detroit, Pittsburgh, Oakland). This mixture shows that just because a team is better than most in certain situations, it does not equate to more wins.
The next graphic looks at a rather dire situation in football, the 3rd and 15+ yards. Again, the graphic is showing average EPA per pass attempts, because in 3rd and 15+ yards a team would almost never run the ball.
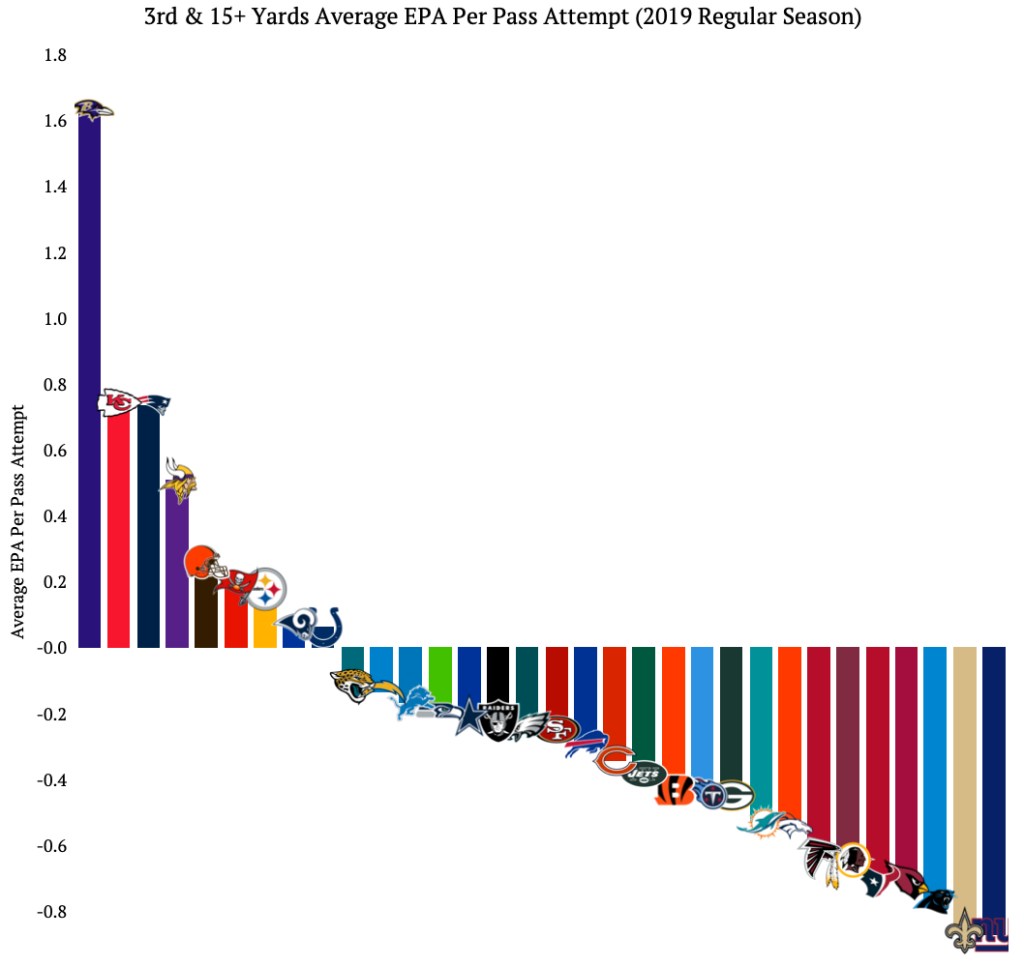
The Baltimore Ravens are by far the best team in this situation. Lamar Jackson was almost unstoppable last season and when his team faced 3rd and 15+ yards he made the most of it.
While the top 4 teams are all playoff teams, there are also playoff teams at the bottom of this measure. The Houston Texans and New Orleans Saints are a few of the teams who did not fare well in these situations, but still were able to win games and make the playoffs.
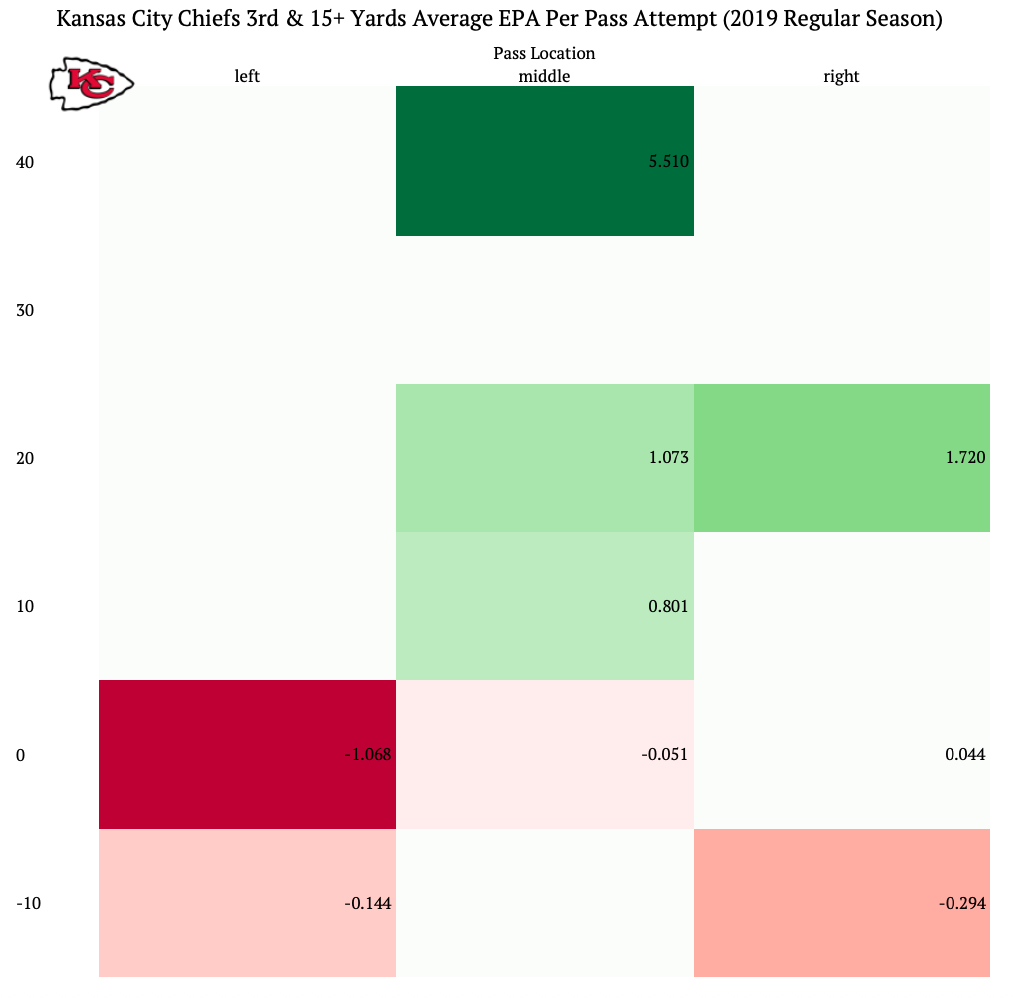
The final two graphics are an extension of the one above. I mapped the Baltimore Ravens and Kansas City Chiefs average EPA per pass attempt on 3rd and 15+ yard situations. This will give more insight into how these teams managed to be in the top two spots above.
The graphics below is essentially a simple map of the field. On the top is where on the field horizontally the ball was thrown (left, right, middle) while the left axis shows how deep the ball was thrown by yard line buckets, each bucket is 10 yards. Green represents a positive average EPA per pass attempts in that location, while red represents a negative.
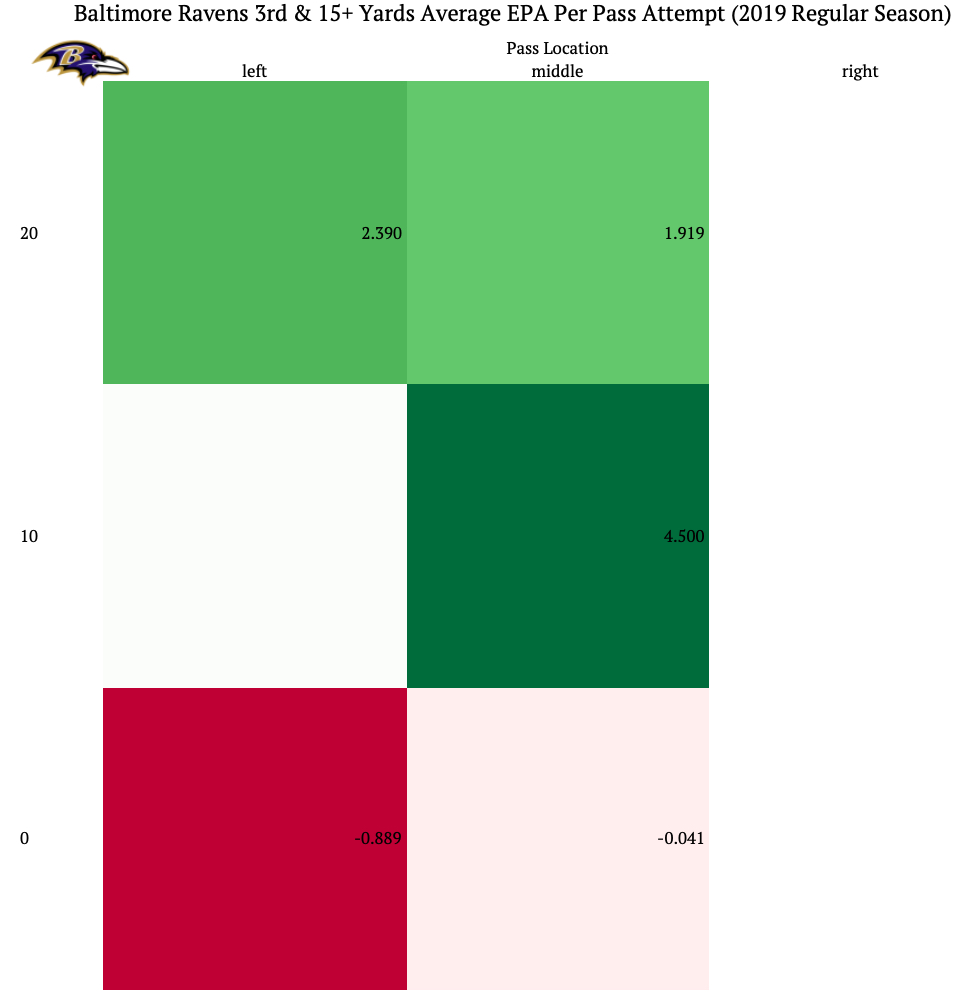
It’s clear these two teams approached 3rd and 15+ yards differently. First, the Baltimore Ravens never threw the ball to the right side of the field on a 3rd and 15+. Second, the Baltimore Ravens never threw the ball more than 20 yards, which would suggest they never really went for more than a first down given 3rd and 15. Third, the Baltimore Ravens preferred passes in the center of the field about 10 yards out.
The Kansas City Chiefs on the other hand preferred the center of the field and they also took some deep shots on 3rd and 15+ situations. The above graphics show how different teams can approach the same situation in a football game.
Data: https://www.rdocumentation.org/packages/nflscrapR/versions/1.4.0

0 comments on “Team Situational EPA”