

As data and analytics continue to become a larger part of the sports world, leagues have created new ways to measure player’s and team’s performances. Expected Points Added (EPA) is one used in football. This post will introduce EPA as it will be something I’ll continue to use in the future.
Expected points (EP) is a measure that was created to calculate to probability of the next score. This probability is based off of a variety of factors such as yard line, yards to go, down, score differential, time remaining, etc. Basically all factors that would impact a football game.
EPA is the difference of the EP at the beginning of the play and the EP at the end of the play. If a player completely outperforms the EP models based on the given situation, that player would have a positive EPA. The opposite would be true for a player who underperforms compared to the EP model, they would have a negative EPA.
While the main point of this article is to introduce EPA, it is also to show that while EPA is a good measure, it is not perfect and it is not the end all stat to measure players or teams (similar to how batting average is not perfect in baseball). You’ll see below that even though teams have great EPA numbers, this does not always translate to wins and successful seasons.
All of the graphics in this article will be looking at EPA numbers from the 2019 regular season.
The first graphic looks at the average EPA per pass attempts by team.
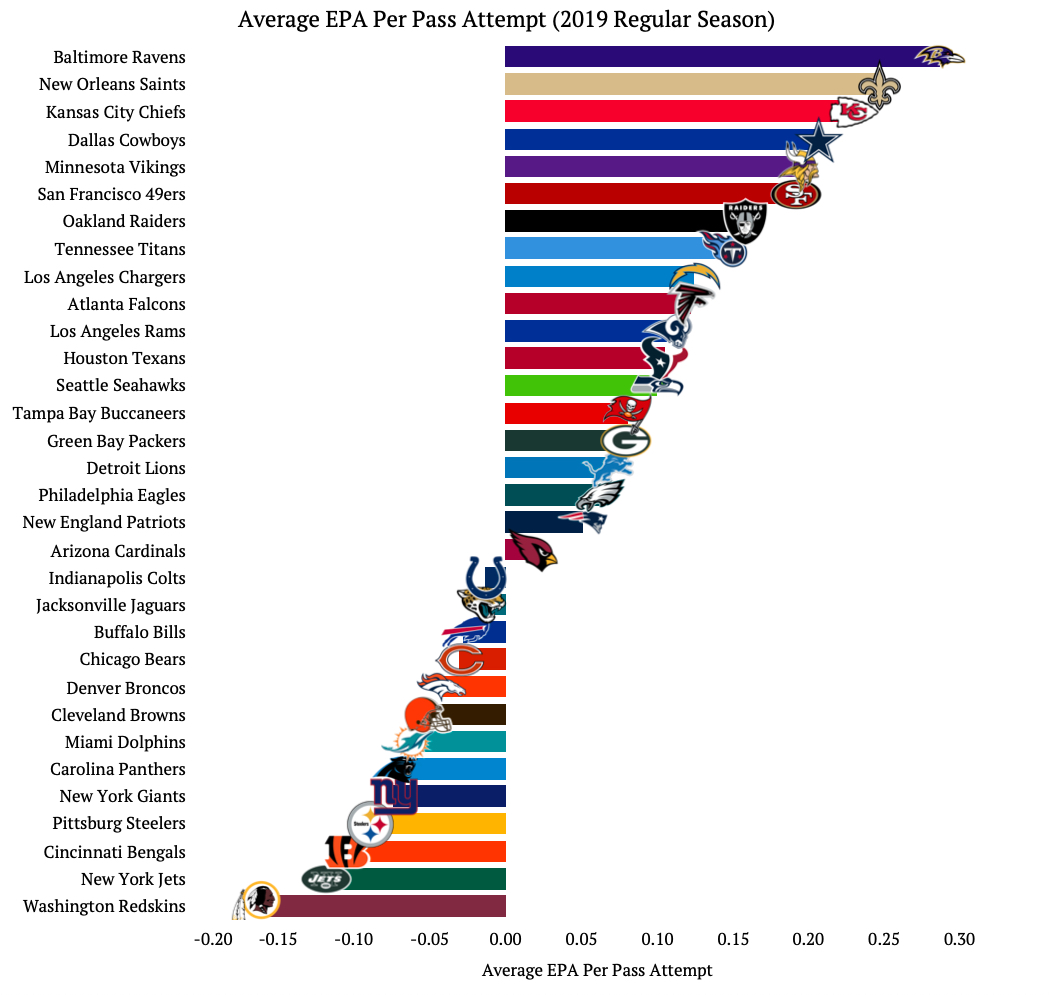
Five of the top six teams in EPA per pass attempt were all playoff teams last season, the one exception being the Dallas Cowboys. Every playoff team except the Buffalo Bills ended the regular season with a positive average EPA per pass attempt.
The Oakland Raiders were a surprise to me. With only a 7-9 record, they still were able to have a better EPA per pass attempt number than 5 playoff teams.
The Washington Redskins were the worst by this measure. They went 3-13 last season and had the worst points scored number of any NFL team.
The next graphic is similar to the first, except it is looking at average EPA per rush attempt.
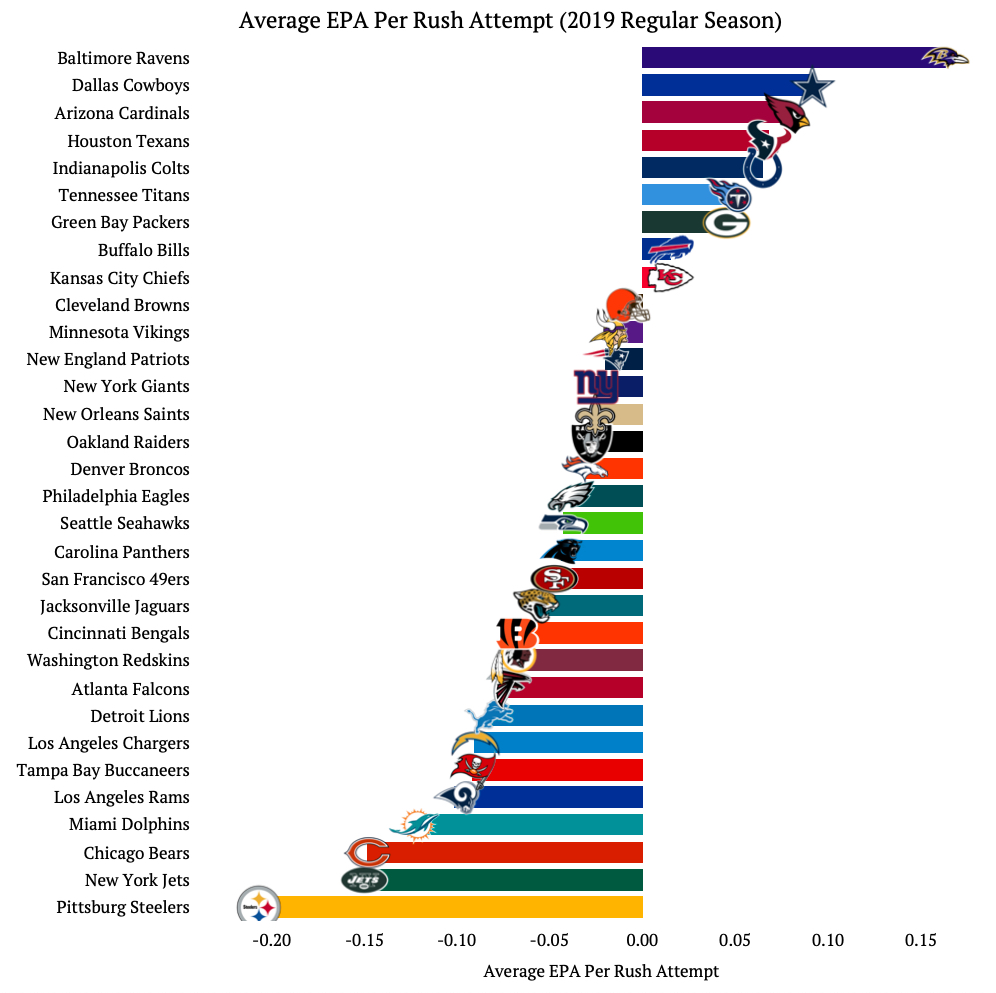
Far fewer teams had a positive average EPA per rush attempt when compared to average EPA per pass attempt. Only 9 teams were able to do this with rush attempts while 19 did it with pass attempts. Some of this has to do with the potential to over-perform the model. What I mean is that a passing play has a far better chance of being a “big play” compared to a running play – this is definitely contributing to the decreased number of positive average EPA per rush attempt.
It’s no surprise to see the Baltimore Ravens as the best team by this measure. The regular season MVP Lamar Jackson was almost unstoppable this year and was able to outperform the probability models.
The third graphic is a combination of the two prior on a scatter plot. This gives a good visual of how teams compare in both EPA per attempt measures. Average lines as well as standard deviation bands have been added for both measures.
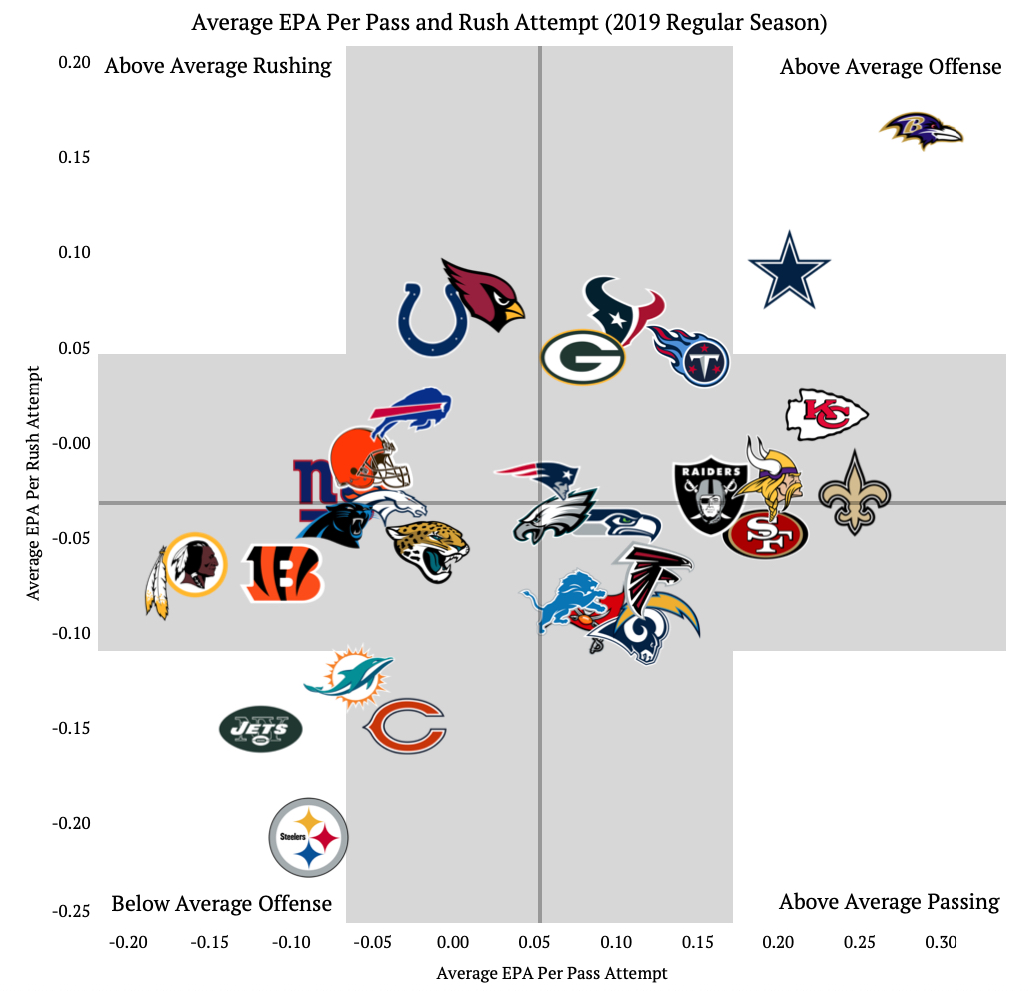
It’s clear the Baltimore Ravens were one of the best offensive teams this past regular season. Every team in the top right quadrant, except for the Dallas Cowboys and Oakland Raiders, were playoff teams last season. The Dallas Cowboys were one of only two teams beyond the standard deviation bands in this quadrant. Even the Super Bowl Champions Kansas City Chiefs can’t claim that.
The New York Jets and Pittsburg Steelers were just plain bad offensively. Of course that is to be expected when you have new and inexperienced quarterbacks.
The final graphic looks at EPA per quarterback scramble. To be included the team must have had at least 16 quarterback scrambles last season, which of course equates to one per game.

The Kansas City Chiefs and the Baltimore Ravens take the top two spots, followed by the New York Giants and the Cleveland Browns.
Interestingly, of all the teams with at least 16 QB scrambles last season, they ended with a positive EPA per scramble. To me this shows how dangerous a mobile QB can be. When forced to use their legs, all of the teams did better than the probability models would’ve predicted.
Data: https://www.rdocumentation.org/packages/nflscrapR/versions/1.4.0

Pingback: Expected Points Added Part 2 – The Commute Sports
Pingback: Team Situational EPA – The Commute Sports
Pingback: Player Comeback EPA – The Commute Sports