

This week’s post is very similar to the NHL Goalie Analysis I posted a few weeks back, but rather than looking at goalies I’m going to look at the other players: wings, centers, and defenseman.
Every graphic in this post includes a measure called “shot angle”; you can find an explanation of that here.
The first image shows every team’s goals last season as well as the median goal angle for those goals. The circles are colored based on their individual “Expected Goal” value. Red means it had a high value, blue means it was low. It’s worth reiterating that all circles in the graphic below are goals, so even a blue circle with a low expected goal value still ended up being a goal.
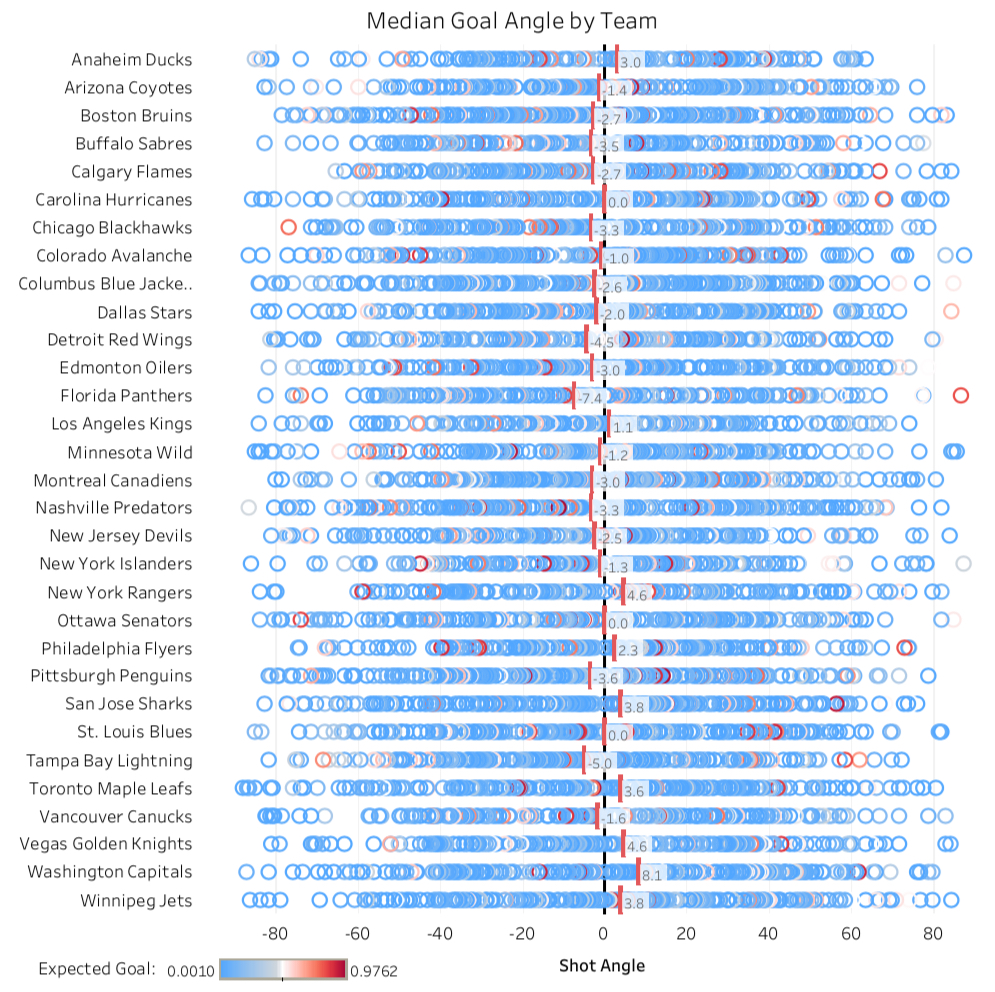
Last season, every team has a median goal angle within -9 to 9. The two extremes are the Florida Panthers at -7.4 and the Washington Capitals at 8.1. The Florida Panthers scored most of their goals to the right of the goal (if you are facing the goal) and the Washington Capitals scored most of theirs on the left.
For the Capitals this shouldn’t be a surprise considering their lead goal scorer Alex Ovechkin plays left wing and tucked 89 goals last season. The Florida Panthers however are a bit unusual. They scored the most from the right side of the ice but their top three goal scorers (Mike Hoffman, Aleksander Barkov, and Jonathan Huberdeau) all play center or left wing.
19 of the 31 teams last season (61.3%) had a median goal angle in the negatives. 3 teams had a 0 goal angle, so they scored as many goals on the left side of the ice as the right: Carolina Hurricanes, Ottawa Senators, and St. Louis Blues.
The next two graphics are looking at goals scored by team, but the goals are separated out into two categories: shooter off wing and shooter not off wing (or on wing). An “off wing” shot is if the shot is from the left side of the ice and the shooter is a right shot, or vice-versa. Of course a shot that is on wing is when the shot is from the left side of the ice and the shooter is a left shot, or vice-versa. Blue means the goal was from an on wing shot and orange means the goal was from a shooter who was off wing.
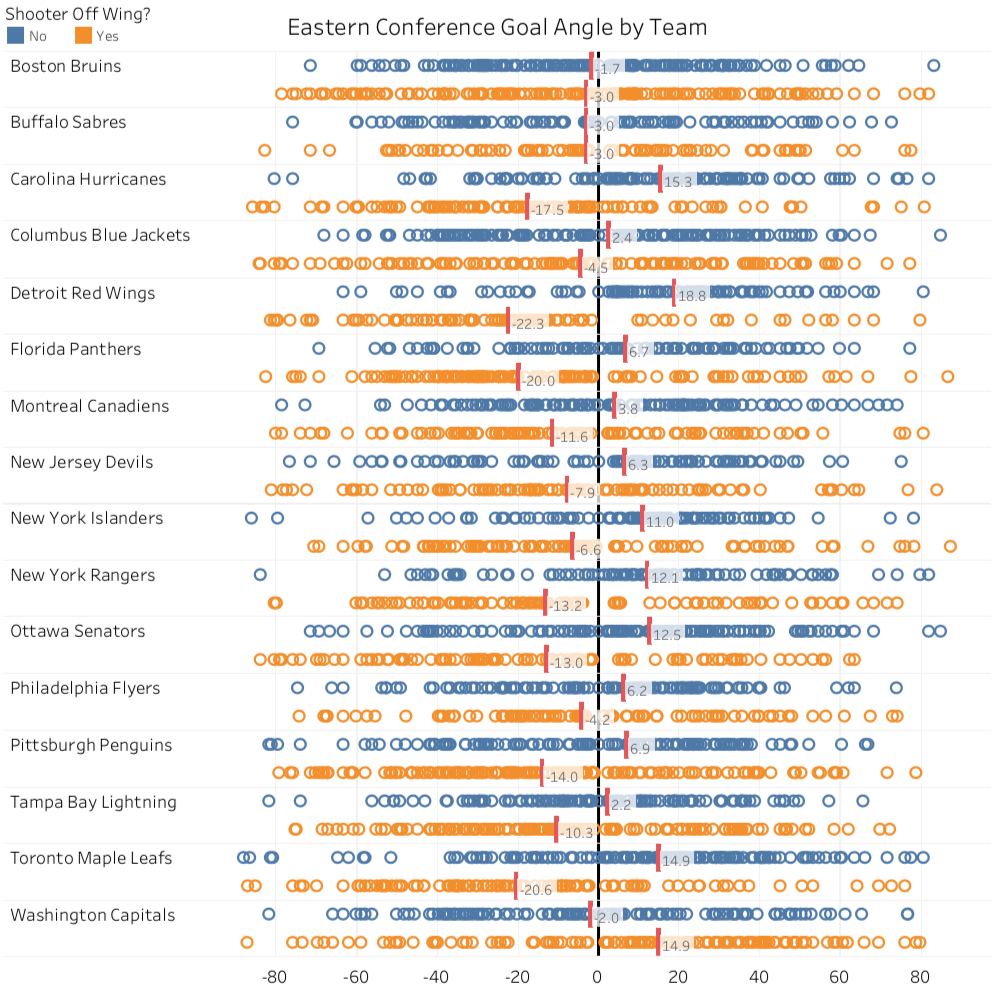

Teams are all over the board on this measure. 25 of the 31 teams have off wing shots in the negatives and on wing shots in the positives. Only the Washington Capitals, Anaheim Ducks, and Nashville Predators have off wing shots at positive angles and on wing shots at negative angles.
The Boston Bruins, Buffalo Sabres, and Winnipeg Jets have both off and on wing shots on the same side of the goal. Boston and Buffalo are in the negatives and Winnipeg is in the positives. Interestingly, these three teams have both measures at or within -3 and 3 which means they distribute their goals from all over the ice regardless of what side the shooter is on.
The most extreme angle on either side is from the Chicago Blackhawks whose on wing shots were from a median angle of 22.6. Of all their players, Dylan Strome had the most extreme on wing goal angle of 41.6. Their superstar Patrick Kane fell into the off wing category with a median goal angle of -37.9.
The final set of graphics look at shot type and angle by position. The first pair of graphs is for “traditional” shot type (backhand, slapshot, etc.) and the second pair of graphs is is for “non-traditional” shot types (deflection, tips, etc.). Both graphics are broken out by position. The first graph in each pair is showing all goals, shots, and misses whereas the second graph is goals only.
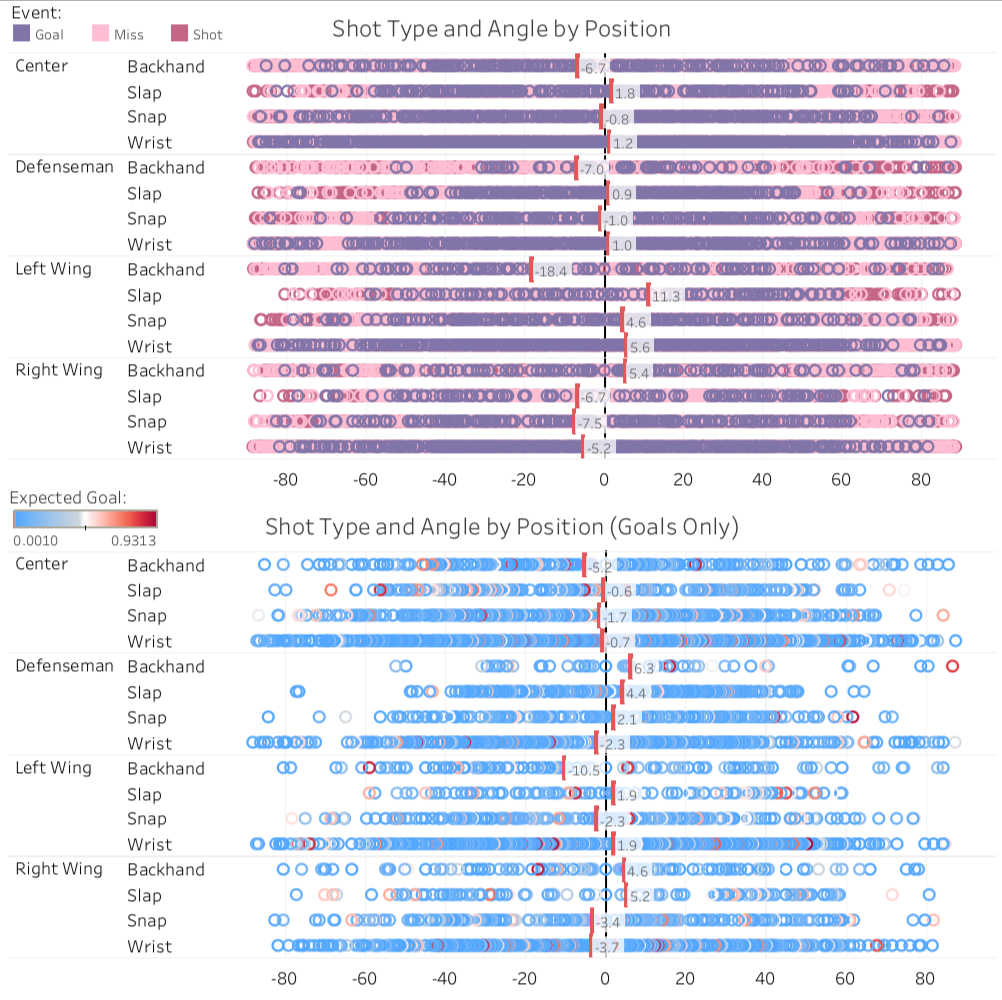
The first thing that stands out is left wings shoot backhanded shots at a median angle of -18.4. Additionally, backhanded shots have the most extreme angle for all positions except right wings.
We also see wrist shot goals are distributed the most across all angles for all positions. This doesn’t mean the median angle is the closest to zero, but the purple circle for goals are basically a solid bar across most of the angles.
When looking at only goals, left wing backhanded shots again have the most extreme angle of -10.5. Interestingly, regardless of the shot type centers had a negative goal angle. We again see that wrist shots are the most popular type of shot and the most effective in scoring goals.
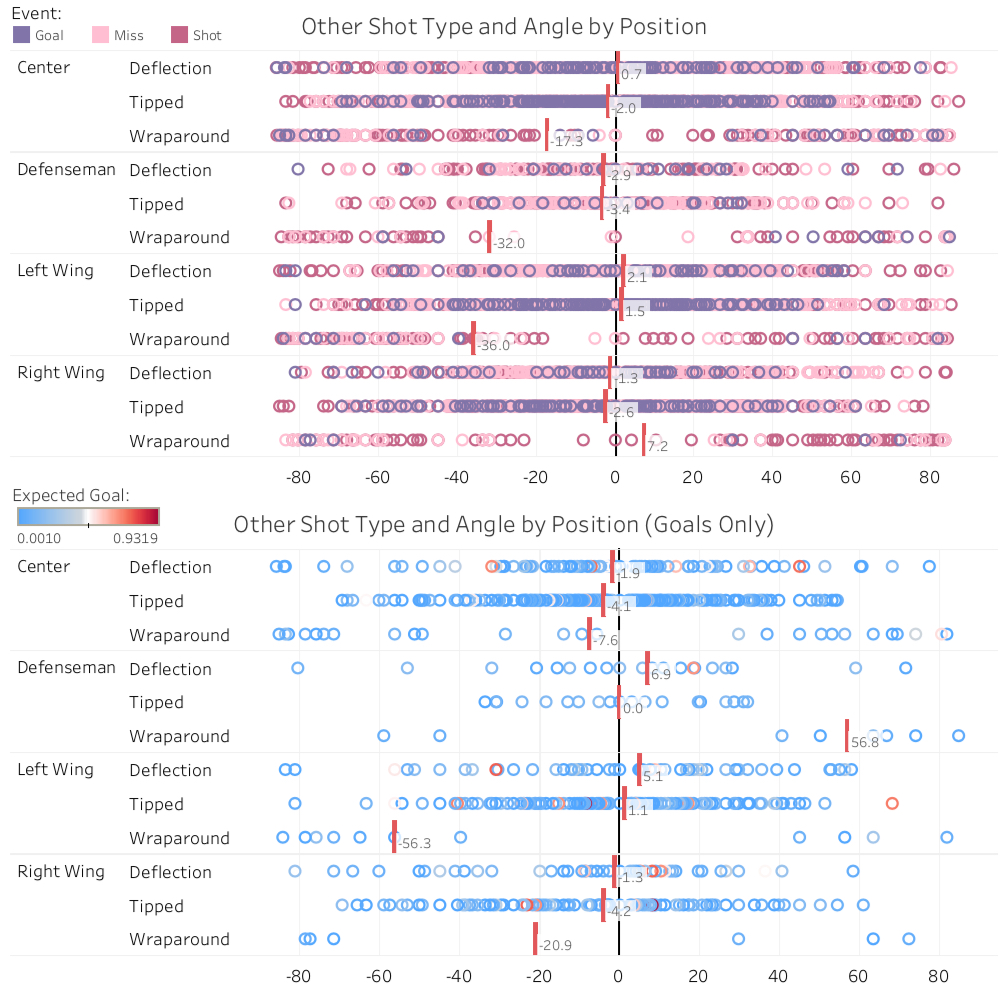
What stands out the most are the wrap around shots, particularly for right wings. While the other positions have more extreme angles, there is a fairly sparse set of shots from about the -20 to 20 range. Because the median is located at 7.2, right in the sparsely populated range, this means wrap around shots are concentrated around either side of the goal.
Deflection and tipped shots being concentrated around 0 was not surprising. To be a deflection or tip another player obviously has to be involved. It stands to reason these would be around 0 because more players are located in front of the net, which is at a 0 angle, and these are the ones that hit the puck causing a deflection or tip.
These same patterns persist when looking at only goals. Wraparound have more extreme angles, but deflection and tips have median goal angles closer to 0.
This type of analysis can be useful when preparing for a certain team. For example, the Blackhawks had a median goal angle for on wing shots of 22.6. Goalies who know this can anticipate shots from around this angle on the ice and either anticipate this or have their defenseman ready for it too.
Data: moneypuck.com

0 comments on “NHL Shooter Analysis”