

With football season officially ending on Sunday (Go Chiefs!), I figured now was as good of time as ever to do my first basketball post. To be completely honest, the NBA is not my favorite sport, so I don’t see myself writing a lot of articles on the NBA. However, I do enjoy college basketball, which is what this post will be about.
Similar to my last couple articles, I’ll be classifying teams based on their performances in different statistics, and visualizing them to give a better understanding of how a team compares to the others.
At the time of writing this (2/3/2020) the top 5 college basketball teams are (AP):
1) Baylor
2) Gonzaga
3) Kansas
4) San Diego State
5) Louisville
As with all of my posts, it is important to keep in mind that the data is as recent as I can make it – all data used in this article is as of 1/31/2020. Additionally, this article only looks at basketball teams from the power 5 conferences, but in future posts I will be including all 353 schools. All graphics in this post have the average value (represented as a line) and the standard deviation (represented as a shaded band) for each measure.
The first graphic evaluates wins based on the team’s strength of schedule. Teams above average in win percent and below average in strength of schedule have easy wins, while teams below average in win percent and above average in strength of schedule have a tough schedule. Teams with below average win percent and strength of schedule are bad. Teams with above average win percent and strength of schedule have difficult wins.
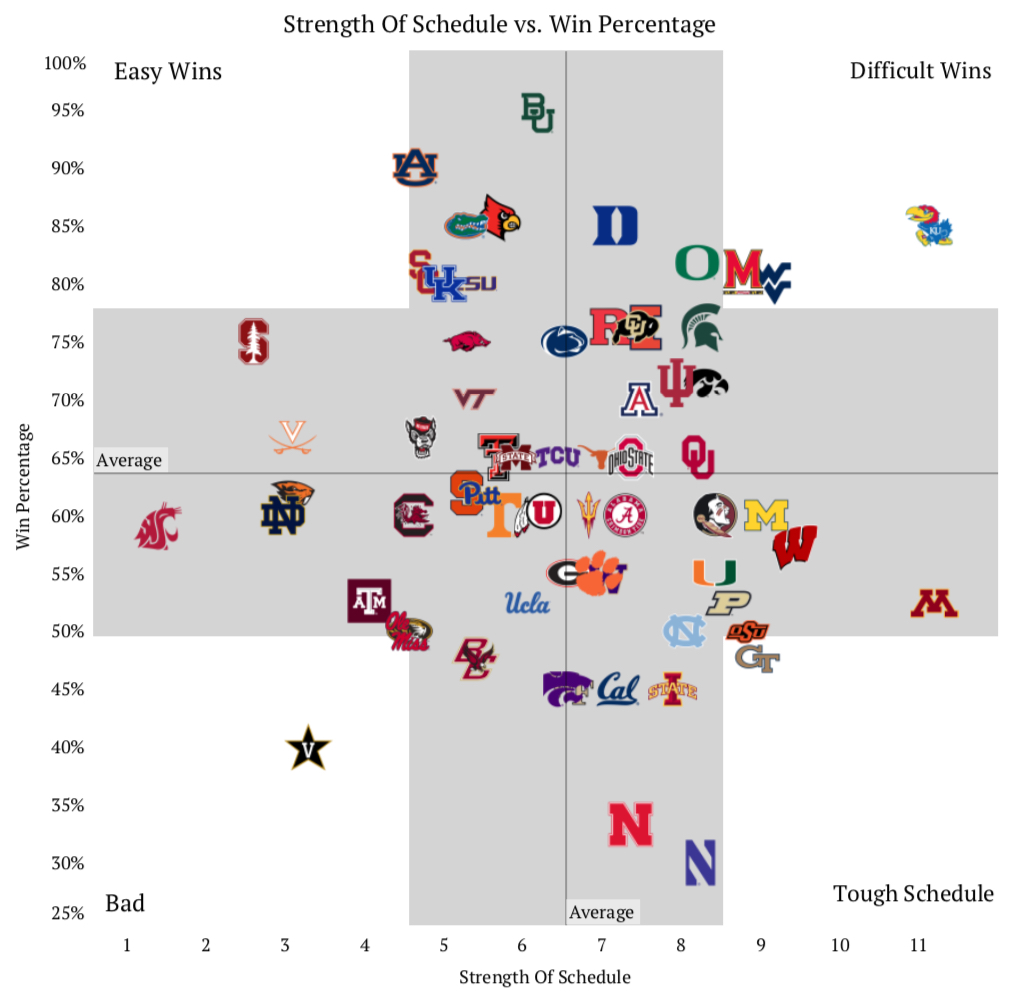
Two schools really stick out above, first the Kansas Jayhawks. They have a win percent of 85 and a strength of schedule of 11.12, which is only behind the Minnesota Golden Gophers for the toughest. It’s always interesting to see if this tough schedule will help them in March when tournament time comes.
Vanderbilt is the other school well outside of the shaded bands. With a win percent of only 40 and a strength of schedule of 3.28, its clear that Vanderbilt is not a major threat to anyone currently.
The second graphic looks at how teams do on the road vs. home. Teams who are above average on the road and below average at home are road warriors. Teams who are above average at home and below average on the road are home bodies. Teams above average in both are good and teams below average in both are bad.

It is very clear that good teams play well on the road and at home. Of the three top 5 schools shown above, all are in the good category, with Baylor well above the pack (note that Baylor has lost one game, but it was at a neutral site).
Again we see Vanderbilt square in the bad category, but this time they are joined by Nebraska, Iowa State, and California, all who have yet to win on the road.
The third graphic analyzes how fun teams are to watch by comparing their pace of play, which is a teams average number of possessions per 40 minutes, and their 3 point attempt rate, which is the percent of total shots that are field goals (because who doesn’t like 3 point shots?).
Teams above average in 3 point attempts and below average in pace are dull, but they shoot more threes. Teams above average in pace and below average in 3 point attempts are exciting, but shoot less threes. Teams below average in both categories are dull while teams above average in both categories are exciting.

Alabama is by far the biggest outlier by these measures. They have the second highest 3 point attempt rate of any school at 47%, behind only Virginia, and they possess the ball 77.7 times in 40 minutes. Thats almost 4 times more than Arizona State, the second most team with 74.
Wisconsin certainly is interesting. Shooting a three 43% of the time, but only possessing the ball 64.2 times. They certainly need to make those shots count with a possession number like that.
California is not only bad, but we learn here that they are dull as well.
The fourth graphic looks at defense – particularly teams’ steal and block percentages, that is what percent of defensive chances end in a steal or a block.
Teams with above average blocks and below average steals have a tough defense. Teams with above average steals and below average blocks have a quick defense. Teams below average in both categories have a bad defense, while teams above average in both have a good defense.

Florida. Wow. While they have the top spot in both steals and blocks at 14% and 17%, respectively, they have a record of 13-8 and are currently tied for fourth in the SEC with 3 other schools. Duke, Penn State, and Kansas also are out of the bands in the good defensive category.
Kansas State and Boston College are the only schools squarely in the quick defense category. Having a block percent of around 8% which clearly is below average, but stealing the ball about 12.5% of the time certainly helps.
California at least has some company this time around?
The final graphic looks at how scoring chances differ among teams. Opponent turnover percent and offensive rebound percent shows us that not all teams are equal.
Teams above average in offensive rebounding percent and below average in opponent turnover percent make more scoring changes on their own. Teams above average in opponent turnover percent and below average in offensive rebound percent are given more scoring chances from the other team. Teams below average in both have less scoring chances while teams above average in both have extra scoring chances.

West Virginia and Duke are the two schools who really have more scoring chances. West Virginia especially because they have an offensive rebound percentage of 40%, which is tied for the best of the power five conference schools, but they also have an opponent turnover percent of 20%, which is over 2% larger than the average.
Arkansas, Stanford, and Boston College have an opponent turnover percent almost 2% larger than the average as well, but clearly are below average in the offensive rebounding category, thus why they are given most of their scoring chances.
Oklahoma is in a world of its own. They have an offensive rebound percentage of only 22% and an opponent turnover percentage of 15%, clearly below almost all other teams.

Pingback: NBA Clutch Ratings – The Commute Sports