
In a previous article I said, “I don’t see myself writing a lot of articles on the NBA.” I’ve completely reversed course. Turns out NBA.com has an incredible amount of stats both at a team and individual level.
This post takes advantage of this and looks into team’s and individual’s performances in clutch situations. Clutch is defined as the last five minutes of a game in which the point differential is 5 or less. All data is as of 2/14/2020, the last game day before the All Star break.
The first graphic simply shows the number of clutch games teams have had so far this season. The Oklahoma City Thunder have the most with 37 while the Milwaukee Bucks have the least with 16. The Bucks are currently in first place in the Eastern Conference which goes to show they are a fairly dominate team if they only have 16 clutch games so far.

The second graphic compares teams total win percentage to their clutch win percentage. A 45 degree reference line is added as well. Teams above the line win clutch games at a higher rate than total games, while teams below the line win clutch games at a lower rate than total games. Another way to think about this is teams above the line overperform in clutch games while teams below the line underperform.
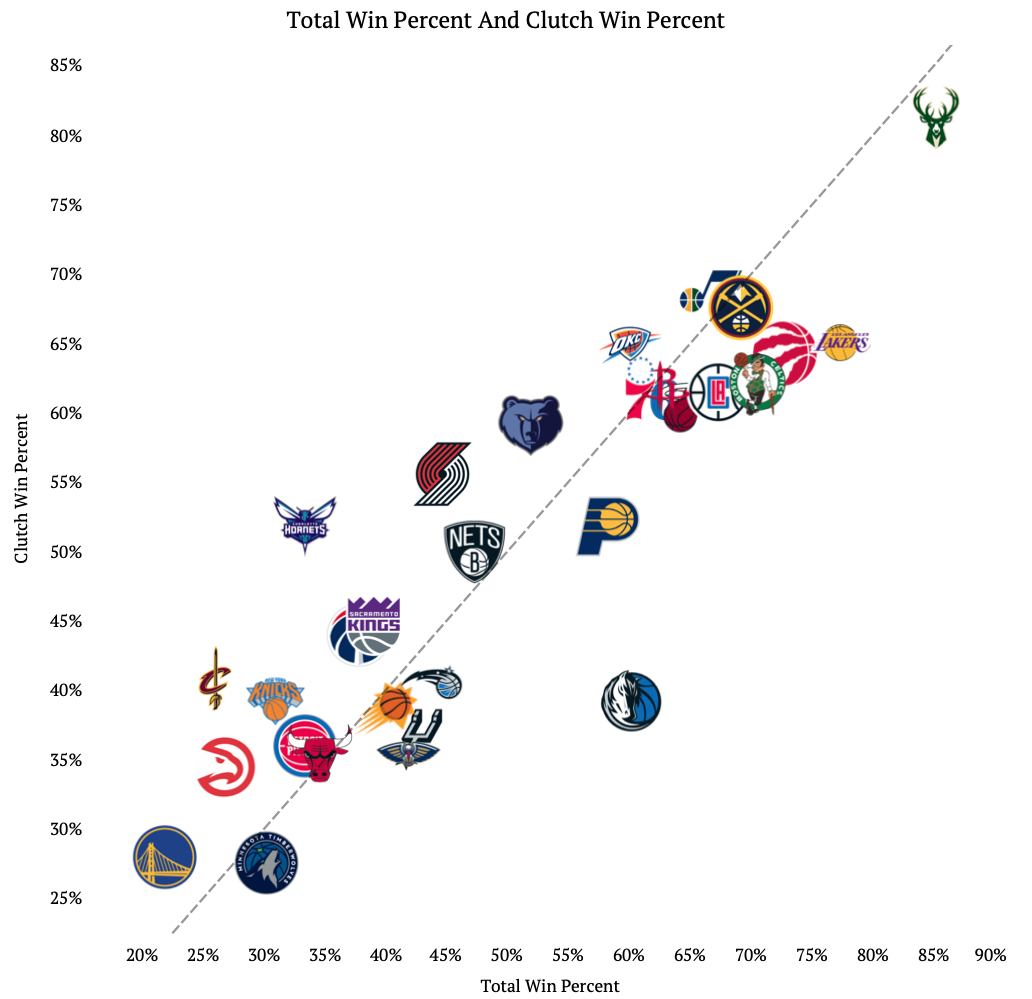
The Charlotte Hornets do quite well in clutch games, winning 52% of them, which is 19% higher than their total win percent. The Dallas Mavericks are one of the worst teams by these measures. They win only 39% , 21% less than their total win percent.
Do keep in mind that this measure is fairly relative. The Milwaukee Bucks are below the 45 degree line meaning they underperform in clutch games, but they still are winning 81% of these, which is only 3% less than their overall win percent.
The third graphic looks at the breakdown of clutch games per team. What percent of total games played are clutch situations, and what percent of a team’s wins are clutch wins. Again, a 45 degree line is added – teams below the line do not take advantage of winning clutch games as much as those teams who are above the line.
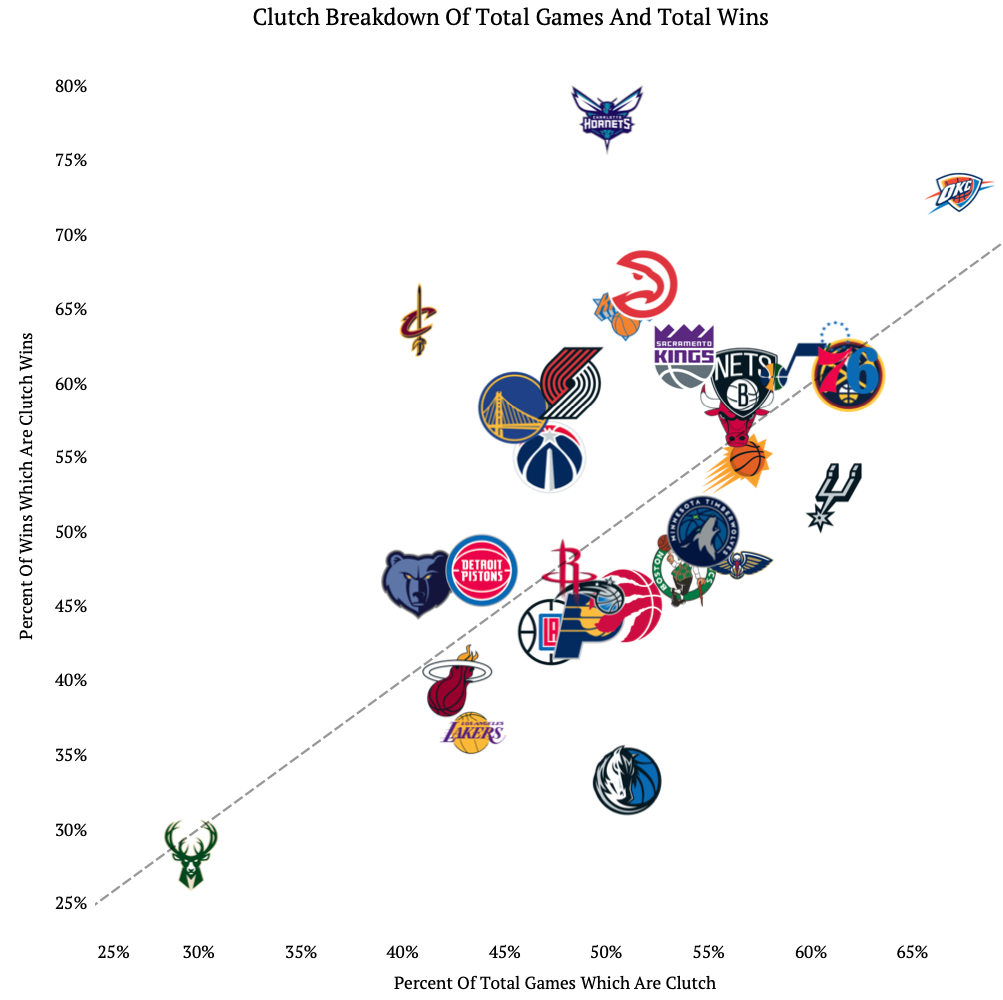
The Charlotte Hornets and Dallas Mavericks stick out again. The Hornets have 78% of their wins coming from clutch games while the Mavericks only have 33%.
The Cleveland Cavaliers are separated from the pack too. Having 41% of their games being considered clutch, and 64% of their wins coming from those clutch games, the Cavaliers are taking advantage of winning close games.
The fourth graphic looks at a team’s offensive and defensive ratings during clutch situations. The shade of the team represents their clutch win percent, which was looked at in the second graphic. Blue is below average while orange is above average.

The best offensive teams in clutch games are the Houston Rockets and Oklahoma City Thunder, however both these teams are in the bottom third of defensive ratings. The Golden State Warriors have the best defense in clutch games, but struggle offensively.
The LA Clippers are the best team on both sides of the ball and they win 62% of the clutch games they are in. They currently are in third place in the Western Conference and I bet their clutch performance helps with that.
The grouping of the Detroit Pistons, Dallas Mavericks, and New Orleans Pelicans is interesting. All teams perform fairly well defensively, but not offensively. The all have a less than average clutch win percent too. It’s clear from that defense does not win you clutch games – offense is what matters in the NBA.
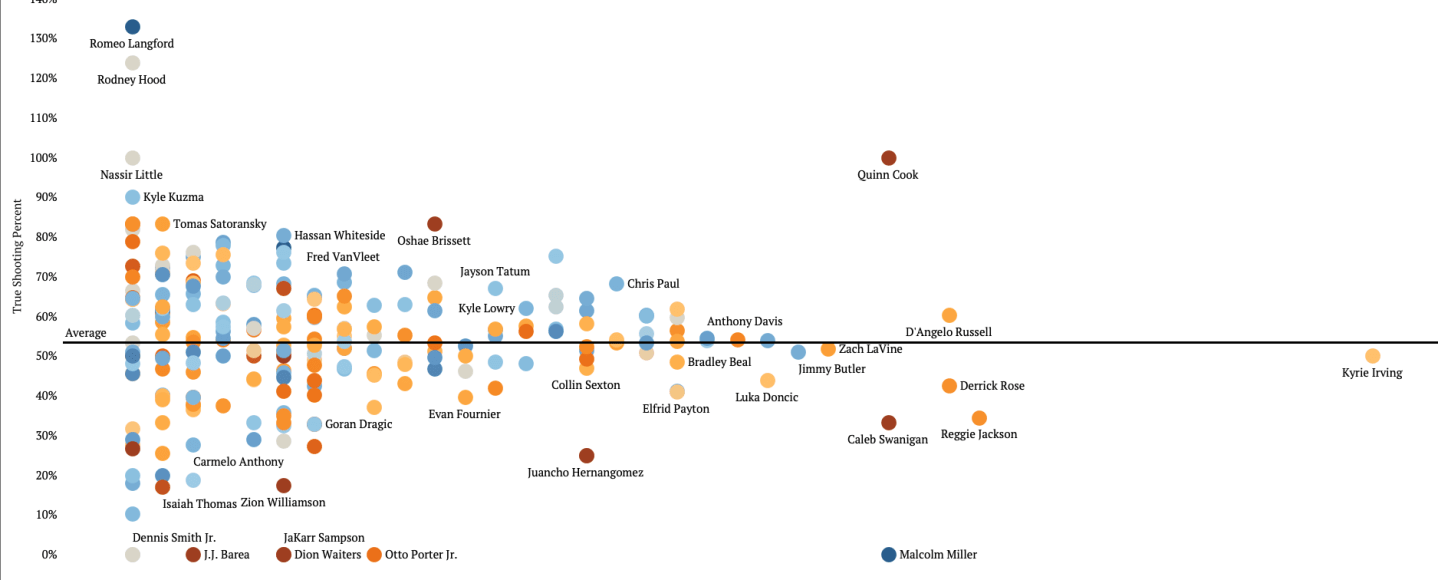
The final graphic looks at individual players in clutch game situations. Field goal attempts per clutch situations (minimum of .5) is compared to their true shooting percent (explanation of true shooting percent can be found here, about 2/3 of the way down). The colors represent clutch win percent for players and the average true shooting percent line is added as well. Note that all data in this graphic are rates per game.

Kyrie Irving takes the most field goal attempts per clutch situation at 4.6, yet he has a true field goal percent of 50% and only wins 45% of the time. Joel Embiid and Chris Paul are two players who stick out for better reasons. They both have an above average clutch win percent and have a true shooting percent of 75% and 68%, respectively.
Malcolm Miller is an interesting case of being lucky and on a good team (Toronto Raptors). He has 3.0 field goal attempts per clutch situation, a true shooting percent of 0%, but a clutch win percent of 100%.
I look forward to digging around the NBA data more and plan on posting more NBA articles. If there is something you want me to look into let me know. Leave a comment below or email me.
Data: https://stats.nba.com/

You miss-spelled the third word in this post.
LikeLiked by 1 person
Updated
LikeLike
Pingback: NBA Play Type Effectiveness – The Commute Sports