

My first real statistical article was originally posted back in November 2019. In that post I created a model to predict how many goals a hockey team would score in a given game. While it had a promising start in the beginning, the model would’ve lost a lot of money had I been betting money based on the results of the model.
In the past few weeks I looked at this model again, tweaked it a few times, created more models, and reran the numbers to see how I would’ve done with the new models back in November.
This post will be comparing four statistical models, all of which predict how many goals an NHL hockey team would score on a given night. The original model is the same one as back in November (details on it can be found here). Model 1, Model 2, and Model 3 are all new models with similar inputs to the original.
The first graphic looks at the profit/loss overtime of the different models. These are based on betting lines for the individual hockey teams on that given night. Vegas creates the “line” of a team’s total goals, this is almost always either 2.5 or 3.5. Betting the over means you think the team will score more than the given line, betting the under means you think the team will score less. The profit/loss of the models depend on if they would’ve correctly bet the over or under.
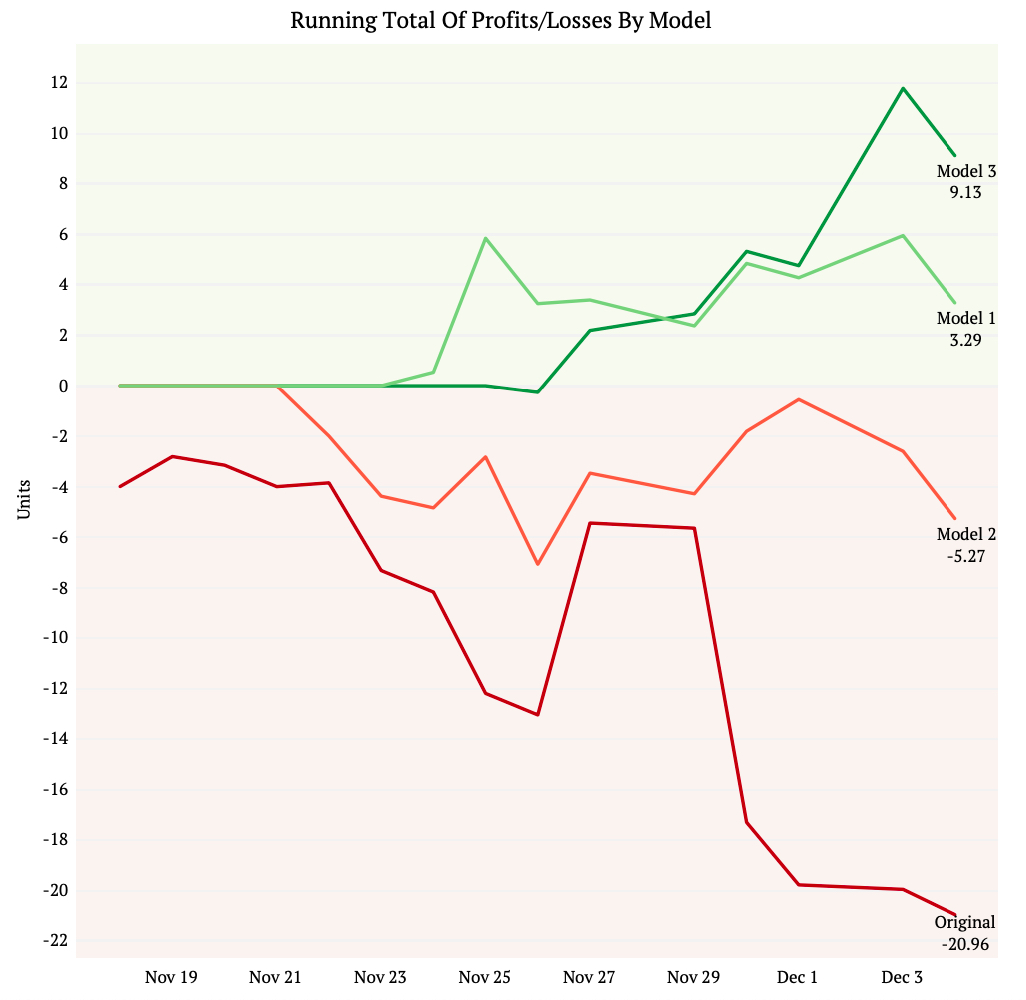
As I said, the original model did not do so well. Through the timeframe above, you would’ve been out 20.96 units. Model 2 also would’ve lost money. Model 1 and Model 3 both would’ve made money. Model 1 with 3.29 units and Model 3 with 9.13 units, the most of all the models.
The next two graphics look at the total profit/loss by NHL team per model. Red means that team was not profitable in the given model, while green means it was profitable.
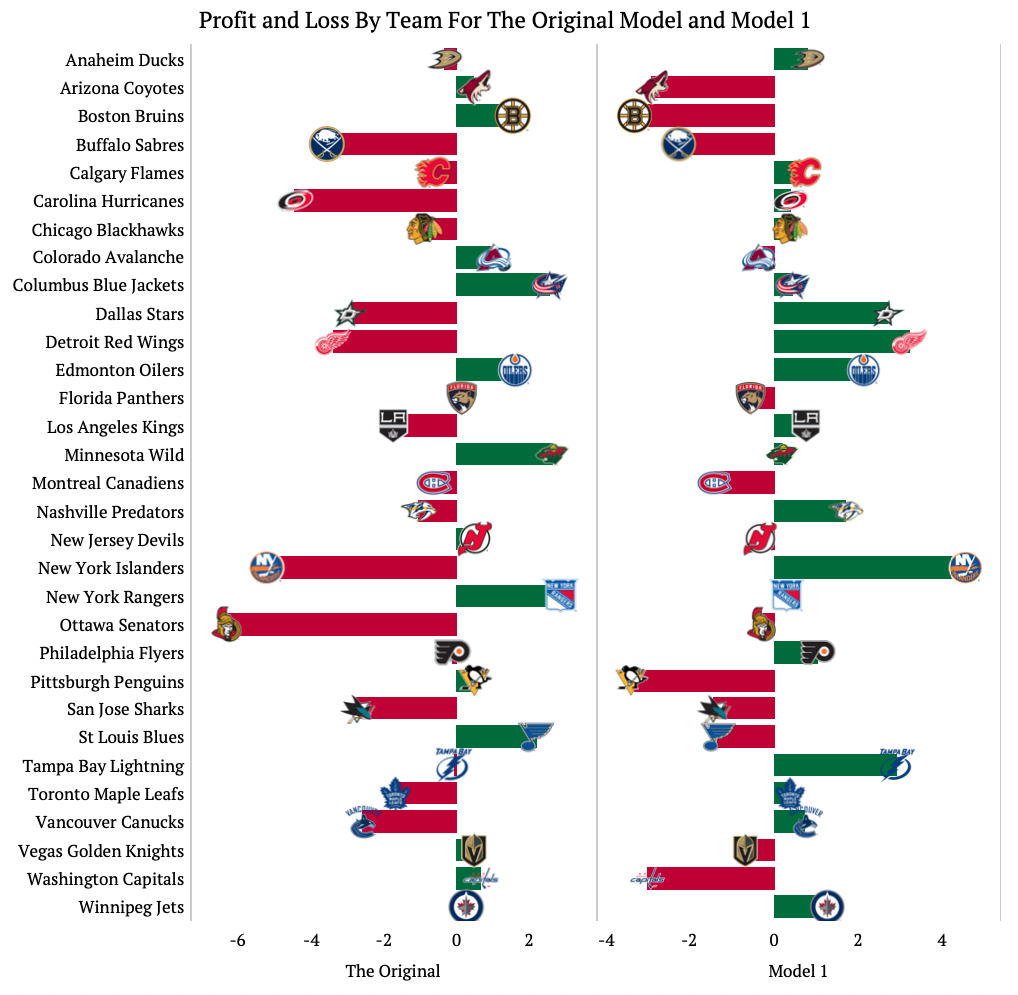
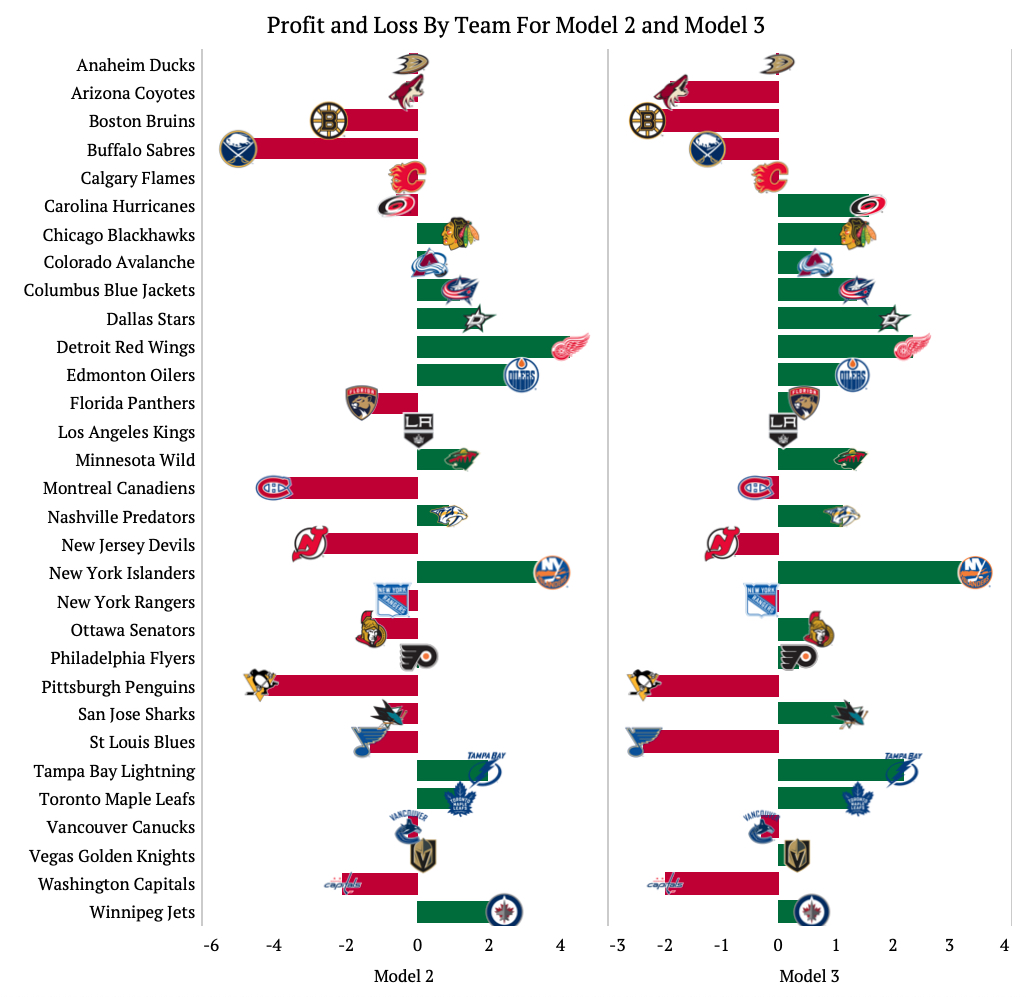
What’s really interesting about this is how different some of the teams can be depending on the model. For example: In the original model, the New York Islanders would’ve lost you about 5 units, but in the other three models the Islanders were one of the most profitable teams to bet on.
The Buffalo Sabres and Montreal Canadians were not profitable in any of the models. The Columbus Blue Jackets, Edmonton Oilers, Minnesota Wild, and Winnipeg Jets were profitable in all the models.
It’s clear from the above graphics that Model 3 is the most profitable model. From here on we will exclusively be looking at it.
The fourth graphic looks at the relationship between some inputs of Model 3: Opponent Save Percentage and Shots For. These are used to estimate the number of goals a team will score, which below is represented by the shade of blue. If the team won that bet it is shown as a circle, but if it lost then it is shown as a cross.
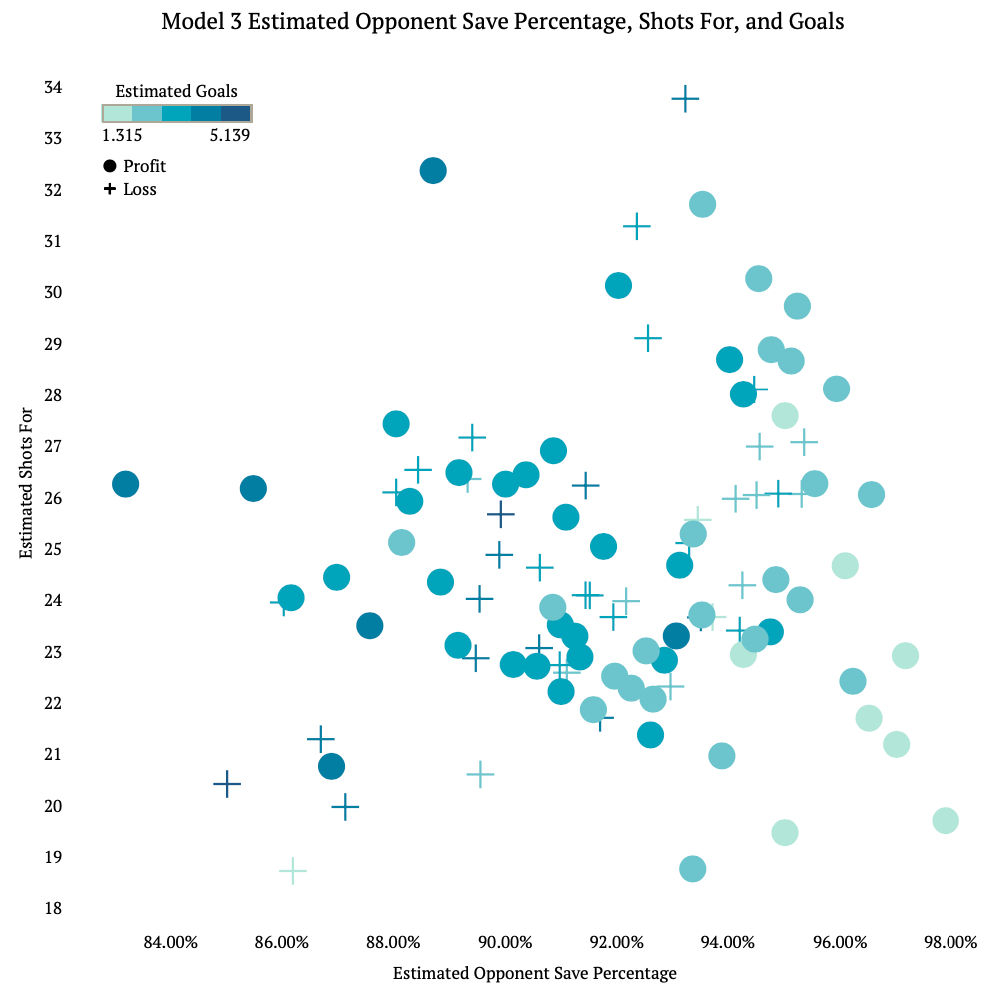
Generally, as estimated opponent save percentage increases and estimated shots for decreases, the model predicts the team to score less goals. This makes intuitive sense because if the opponent’s goalie is better and the team does not shoot as much then one would probably not score as many goals.
We see though that winning bets and losing bets are all scattered through out. This is because to win the bet you have to pick correctly based on where the betting line is set. Some team’s lines are higher than others so to win you couldn’t just pick every team to score 3 goals a game. This also is due to the inherent chance involved in sports – any team could under or over perform depending on a number of factors outside of anyones control.
The final graphic looks at the errors in Model 3. The X axis is the estimated number of goals for a team, while the Y axis is the difference between the estimated number of goals and the actual number of goals scored. The actual number of goals scored is represented by the color of the circle. The linear trend line was added as well.
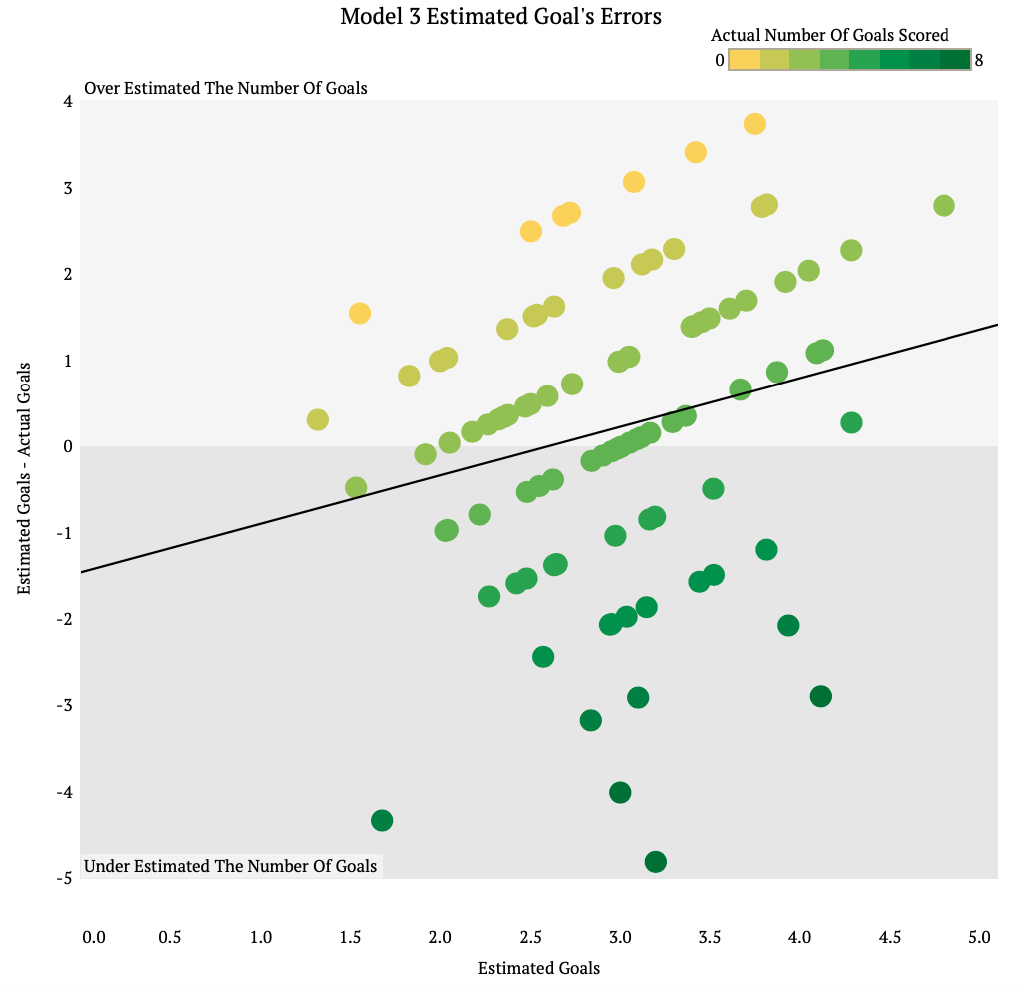
The trend line indicates that as the model estimates a higher number of goals, it tends to be too high, which makes sense of course. If the model said a team would score 10 goals one would probably think that this is too high.
What is interesting about this too is how wrong some of the model’s predictions were, but that this model was still the most profitable. What really matters in this type of betting is that you are wrong the right way.
Take the following example: if the betting line for a team is set at 2.5 goals and model estimates the team to score 3 goals then you would bet the over. With this in mind, think about the three scenarios below for what could actually happen.
1) The team scores 3 goals
2) The team scores 8 goals
3) The team scores 2 goals
In the first scenario you have an error of 0 and win the bet (the model was accurate). In the second scenario you have an error of -5 and win the bet (the model under estimated). In the third scenario you have an error of 1 and lose the bet (the model over estimated). So while scenario 3 has a smaller absolute value of error than scenario 2, it is on the “wrong side” of the line, and thus is a losing bet.
Obviously I wish hockey was still on and I could test Model 3 on more game lines and more games to have a better understanding of its profitability, but for the time being I’ll just have to wait.

0 comments on “Revisiting The Hockey Scoring Model”