
Not all shots in hockey have the same chance of being a goal. A shot right in front of the net coming after a rebound has a much higher chance of being a goal than a shot from the other side of the ice.
However on the stat sheet these two shots are the same even though we know one is much more valuable than the other. This problem is exactly what an expected goal (xGoal) model is trying to solve. A shot should have more value when it has a higher probability of being a goal.
Although many hockey analytics sites have their own xGoal model and share their data publicly, I decided to make my own. Primarily I needed it for two other NHL models I’ve created – both of which I will be sharing shortly.
My model is based on the one from moneypuck.com, it focuses largely on how quickly and how far the puck moves from the previous event. The thought here is that quick movements provide a better indicator that a shot will be a goal.
The xGoal model is a logistic regression primarily built with XGBoost and sklearn. There is no special machine learning, boosted trees, etc. in this model as it simply was not needed. This problem is a fairly simple one perfect for logistic regression.
As a whole, our two models do a fairly similar job of saying who has been the best at creating quality shots. Below is a graphic that compares the total xGoal values of skaters from the 2014 to 2021 season between the two models. Both have the same top 4, and while the order is slightly different after that, 8 of the 10 skaters match between the models.

While that is a good sanity check on my model to an accepted baseline, let’s look into some particular shots and see how my model values different items to generate the xGoal value.
First is a pretty standard hockey play. They was a hit around the blue line, then 6 seconds later there was a wrist shot from the inside circle from 20 feet away.
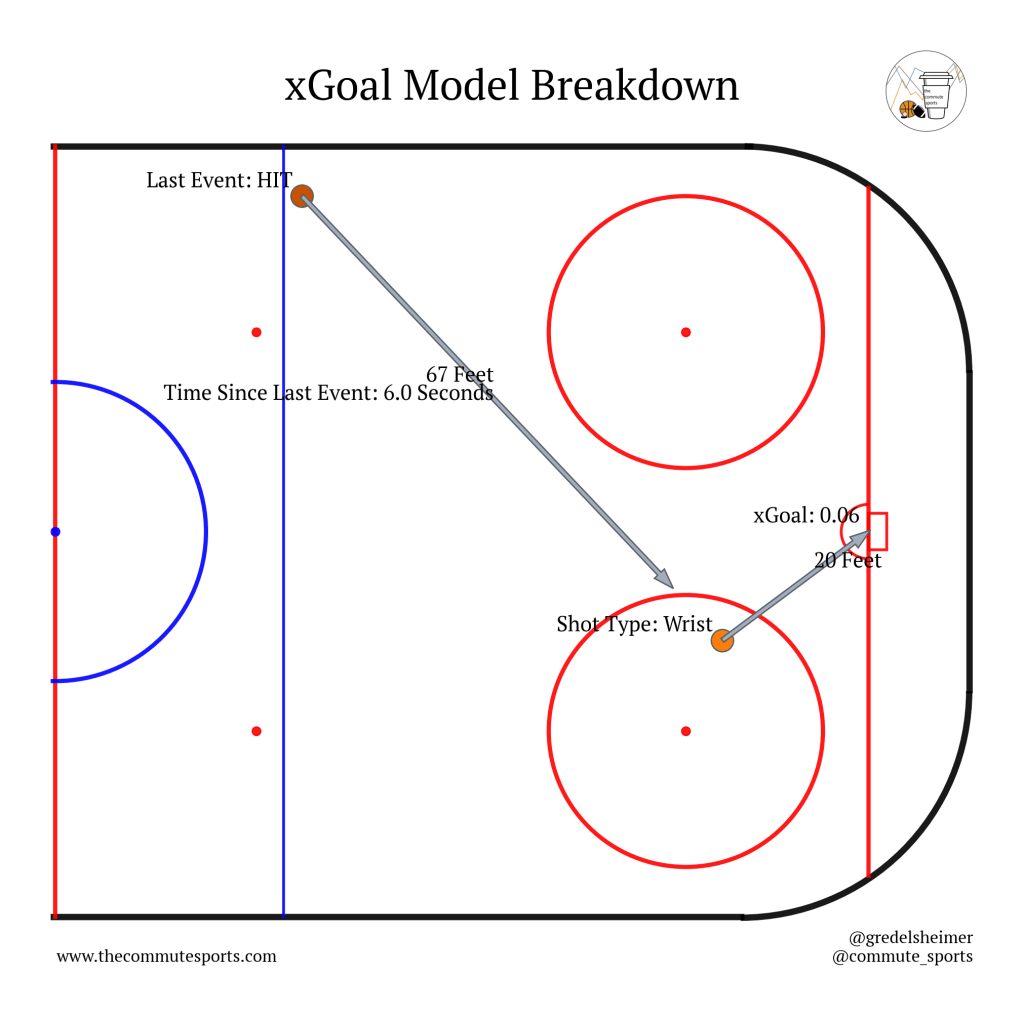
*Note that the arrows just denote the sequence on how the ice events happened. It does not necessarily mean the puck followed this direct path
Above we see this shot had an xGoal value of 0.06. Said differently, this shot had a 6% change of being a goal. This is somewhat low, but that is to be expected here. There was a decent amount of time between the hit and when the shot took place, the distance between the hit and the shot is fairly far, and finally the shot is not super close to the net.
Next, let’s look at a shot that generated an xGoal value of 0.13 , over twice the value of the previous one. This shot came two seconds after the opposing team turned the puck over in their defensive zone. The puck moved quickly to the inside circle where the shot was taken from 20 feet away.
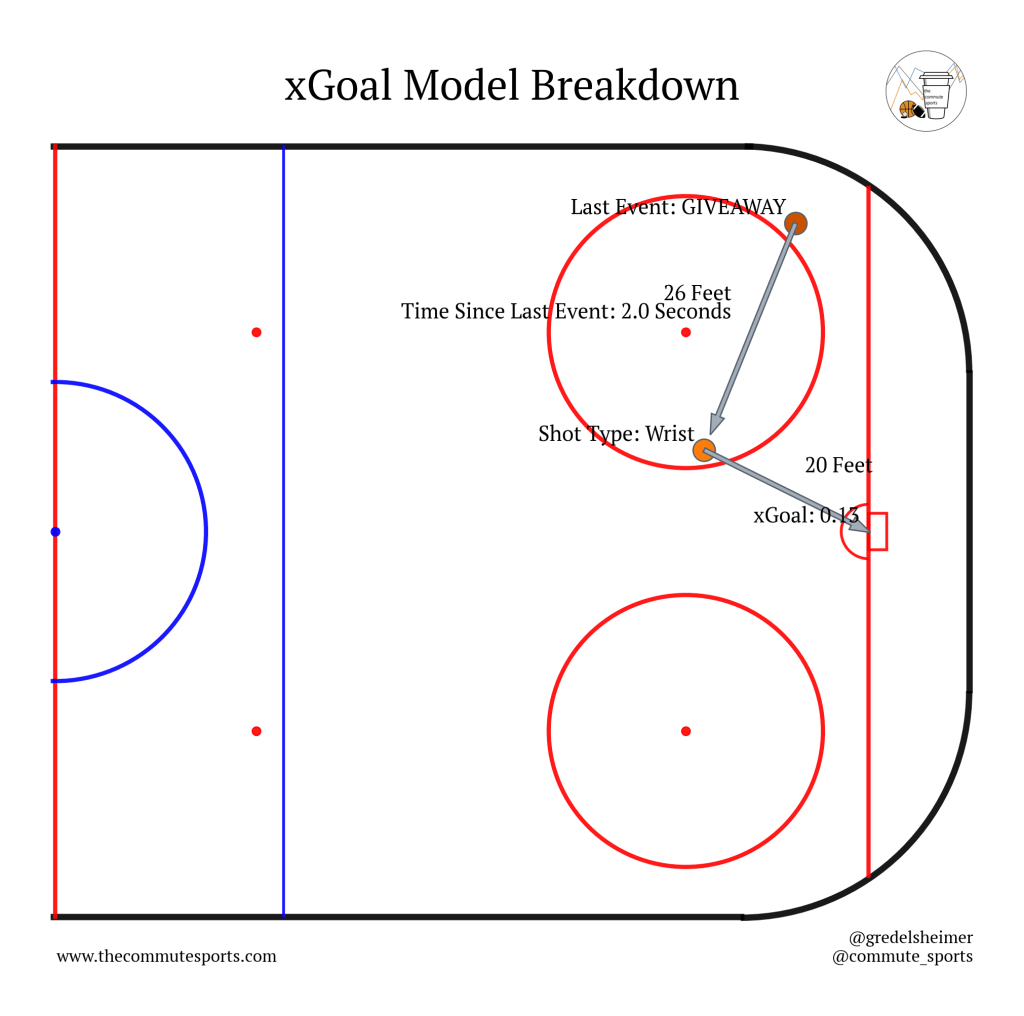
Notice that even though this shot was in a very similar location as the first it has a higher xGoal value. This is due to two things:
1) how quickly the puck moved from the previous event to where it was shot from
2) the TYPE of event that happened before the shot
My model values not only the location of the last event, but also the type of the last event. It values face-offs, hits, shots, takeaways, etc. all differently.
Third, a shot that generated a very high xGoal value of 0.32.

We can see there was a face-off before the shot took place. 4 seconds after this the puck was 8 feet in front of the goal where the shot took place. This shot had a very high probability of being a goal according to my model.
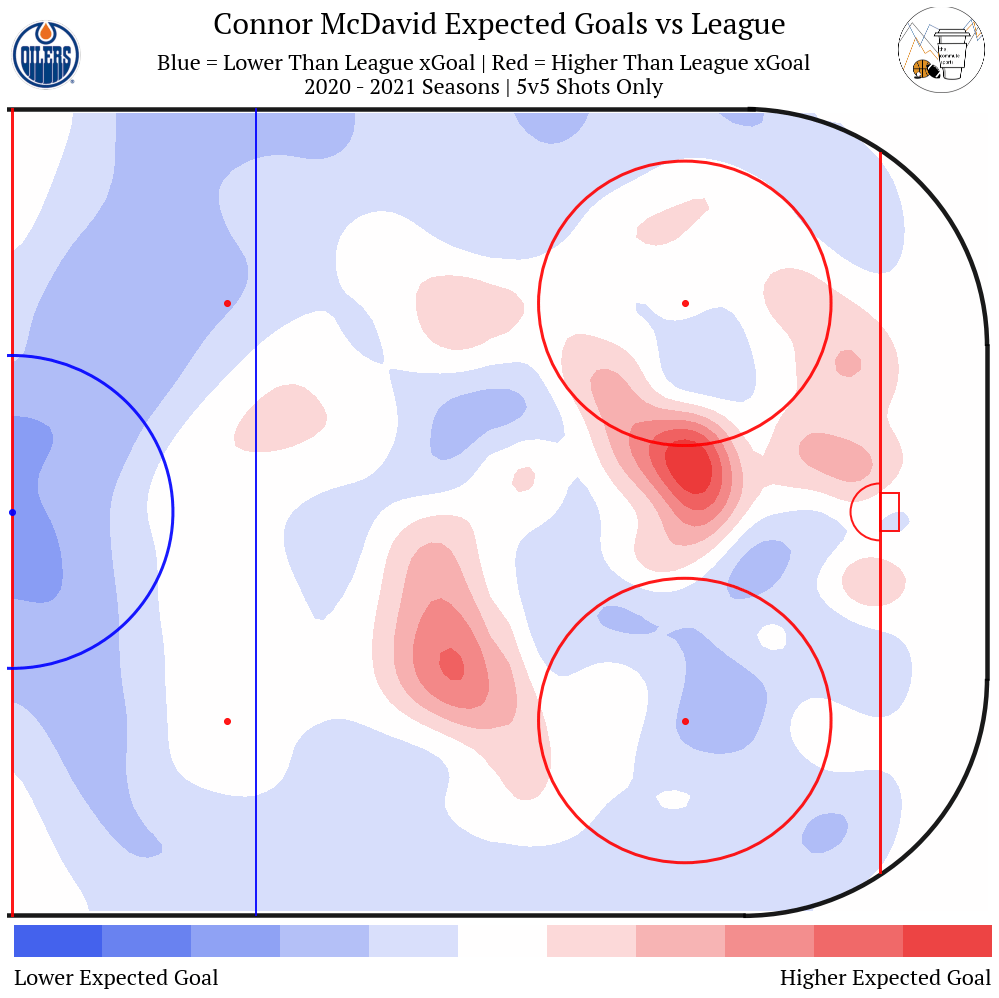
Finally, let’s look at how the two models differ in terms of an individual player. In my last article we learned how we could to create an xGoal map of Connor McDavid. This was done using moneypuck’s xGoal model. I’ve made the same graphic, but used my xGoal model. The two results are below.
Commute Sports xGoal Model:
Moneypuck xGoal Model:

The main differences occur around the net and from the top of the right circle. My model values his shots from these locations more than the moneypuck model.
An xGoal model is something that is really helpful in hockey analytics because it measures the quality of shots rather than just the volume. This xGoal model is an extremely important part to two other models I will be sharing shortly: my matchup & total goals models.

Pingback: New NHL Predictive Models – The Commute Sports